# Spring debugger
IntelliJ IDEA helps you handle many Spring-specific issues at design-time. However, some of them might require a runtime investigation. For this case, IntelliJ IDEA's debugger recognizes Spring context and provides you with tools to inspect and interact with Spring applications running in debug mode.
> **Tip:**
> This topic only describes the features that are specific to the Spring debugger. For more information about the framework-agnostic debugger features, refer to the [Debugger](debugging-code.html) section.
Procedure: Install the Spring Debugger plugin
This functionality relies on the Spring Debugger plugin, which you need to install and enable.
> **Note:**
> The Spring Debugger plugin is not available in IntelliJ IDEA without the Ultimate subscription.
1. Press `Ctrl+Alt+S` (Windows), `⌘ Comma` (macOS), `⌘ Comma` (IntelliJ IDEA Classic (macOS)), `⌘ Comma` (macOS System Shortcuts), `Ctrl+Alt+S` (XWin), `Ctrl+Alt+S` (GNOME), `Ctrl+Alt+S` (KDE), `Ctrl+Alt+S` (Emacs), `Ctrl+Alt+S` (Sublime Text), `⌘ Comma` (Sublime Text (macOS)), `Ctrl+Alt+S` (NetBeans), `Ctrl+Alt+S` (Visual Studio), `⌘ Comma` (Visual Studio (macOS)), `Ctrl+Alt+S` (Eclipse), `⌘ Comma` (Eclipse (macOS)) to open settings and then select `Plugins`.
2. Open the Marketplace tab, find the Spring Debugger plugin, and click Install (restart the IDE if prompted).
Spring debugger is supported for the following [run configuration](run-debug-configuration.html) types:
* [Spring Boot](run-debug-configuration-spring-boot.html)
* [JUnit](run-debug-configuration-junit.html)
* [TestNG](run-debug-configuration-testng.html)
* [Maven](run-debug-configuration-maven.html)
* [Gradle](gradle.html)
* [Remote JVM Debug](attach-to-process.html)
## Review the current configuration
Properties defined in a `.properties` are often overridden at runtime, either by another `.properties` file or a bean. If the actual value at runtime is different from the one specified in a `.properties` file, the corresponding line gets an [inlay hint](inlay-hints.html) revealing the actual configuration value.
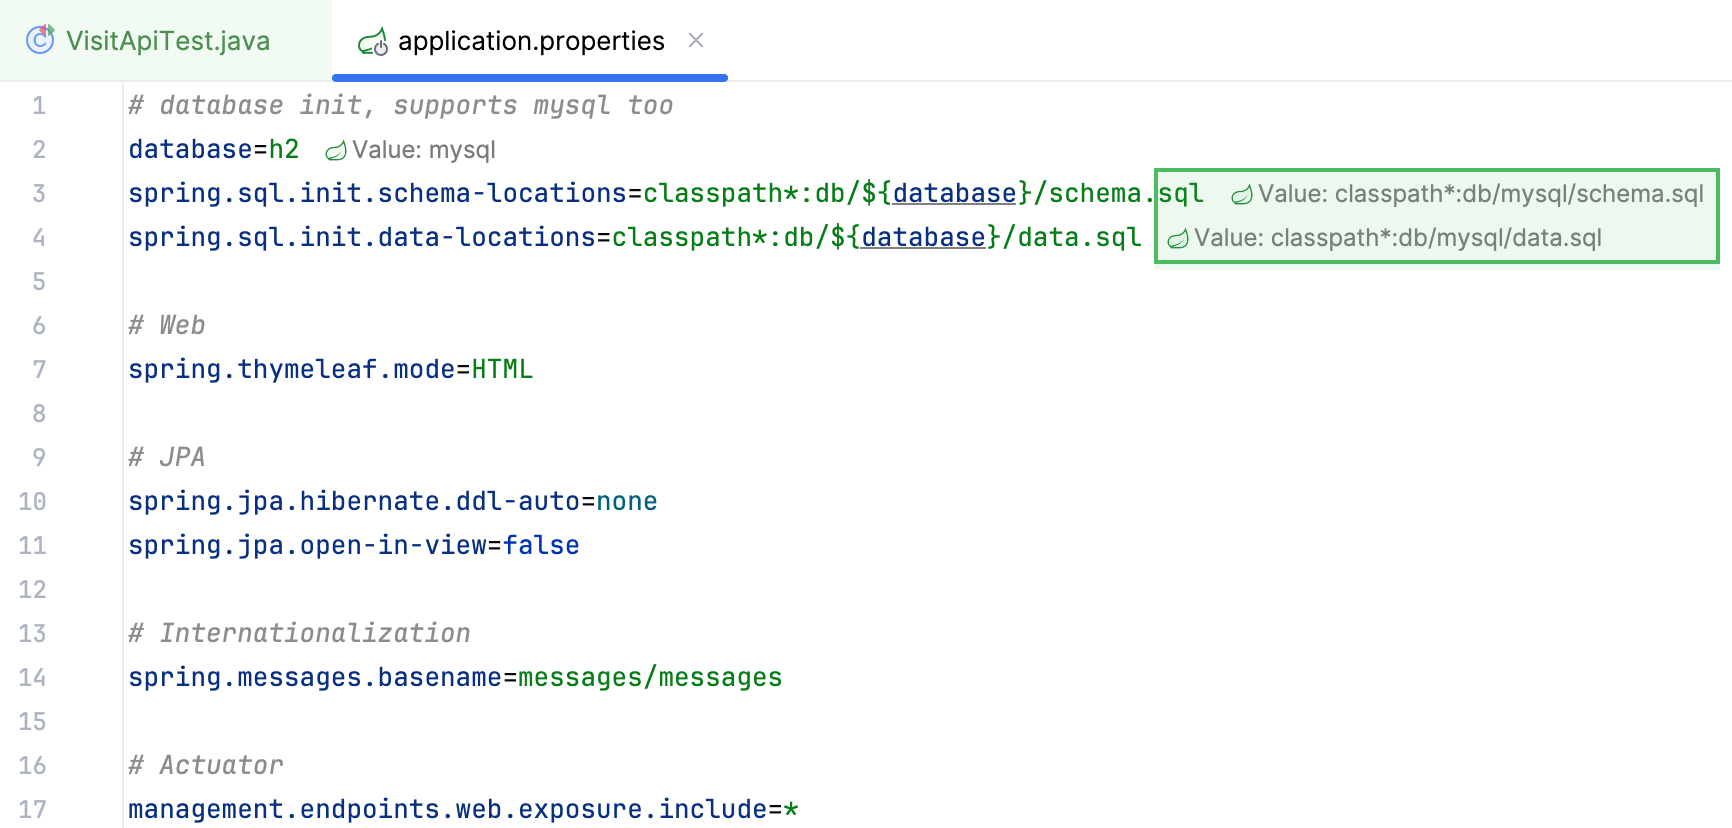
If a property is defined in multiple contexts, the inlay hint shows multiple definitions.
Procedure: Navigate to the property redefinition
* To see which piece of code overrides the property value, click the inlay hint that shows the actual value. The overriding code opens in the editor.

## Database connections
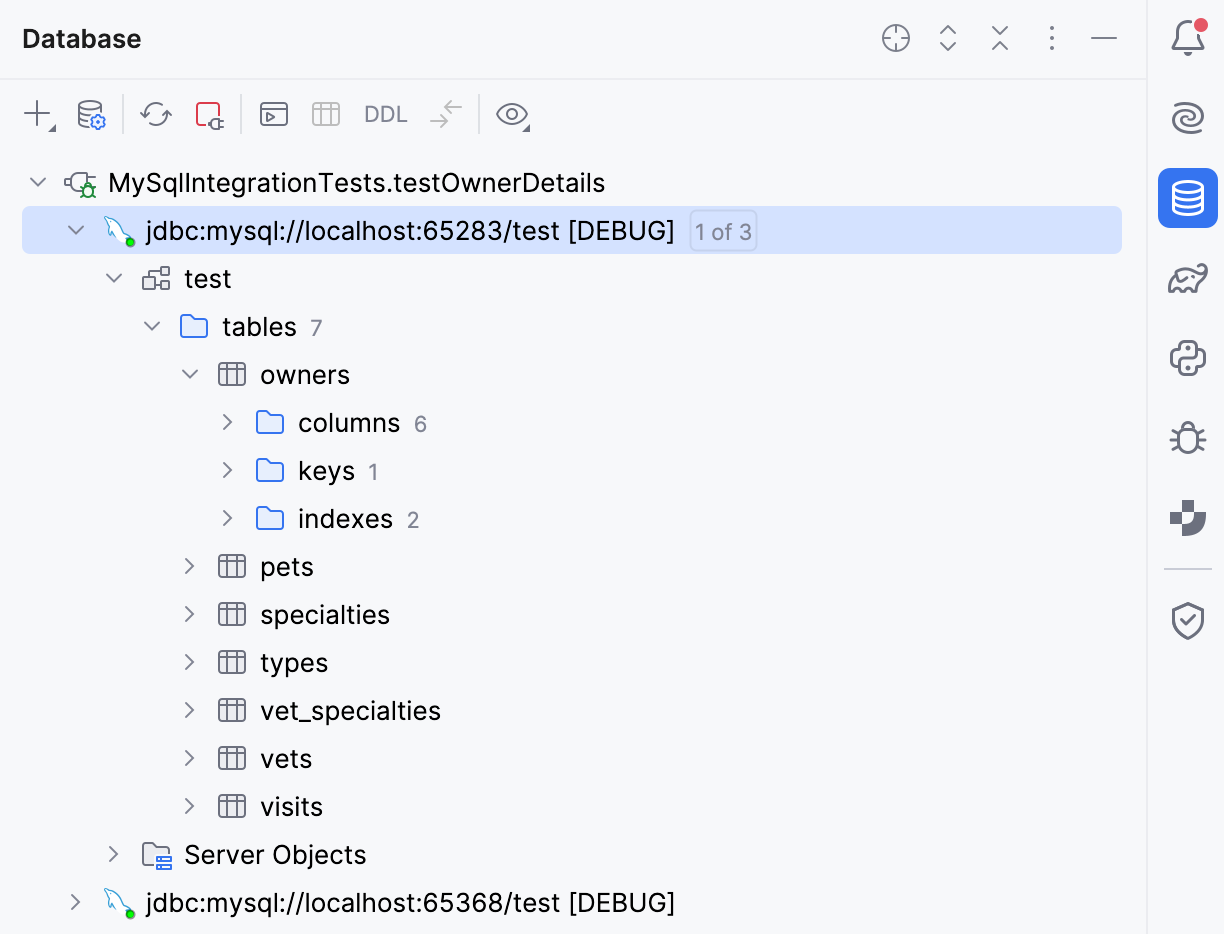
When you are running your Spring application in debug mode, IntelliJ IDEA displays the current database connections in the Database tool window.
Among other scenarios, this might be useful when you are working with:
* [Testcontainers](https://docs.spring.io/spring-boot/reference/testing/testcontainers.html)
* A [data source](managing-data-sources.html) that is not yet set up in IntelliJ IDEA
* Numerous databases such as in the case of microservices
* An orchestration tool, such as [Docker Compose](docker-compose.html)
Procedure:
1. Run a Spring application in [debug mode](starting-the-debugger-session.html).
2. Open the [Database](database-tool-window.html) tool window.
3. Click the Refresh button.
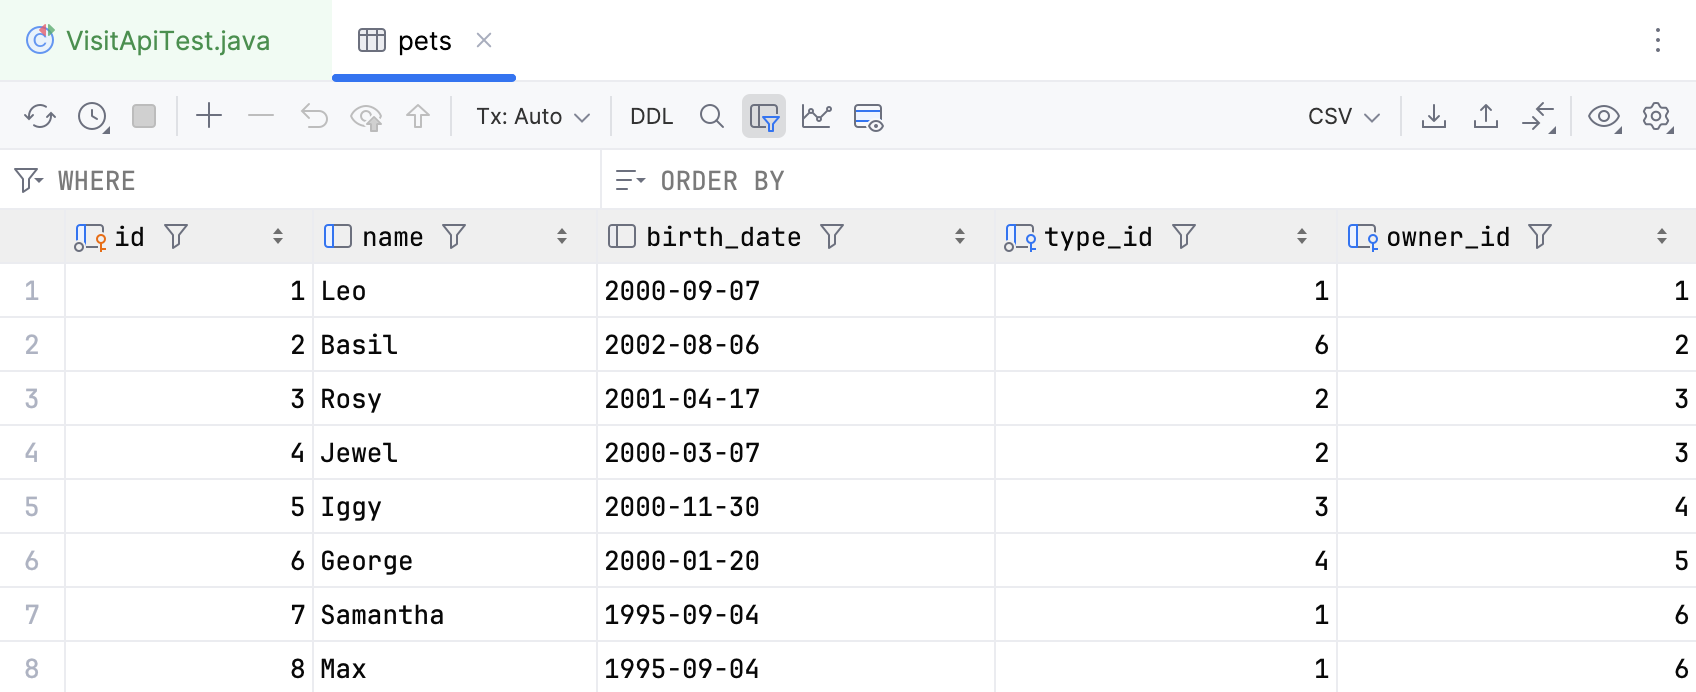
In the discovered databases, you can view the tables, directly execute SQL queries, explore the schema, and so on, similar to how you would with any other [data source](managing-data-sources.html).
> **Tip:**
> For more information on working with databases from IntelliJ IDEA, refer to the [Database Tools and SQL](quick-start-with-database-functionality.html) section.
## Spring context in debugger expressions
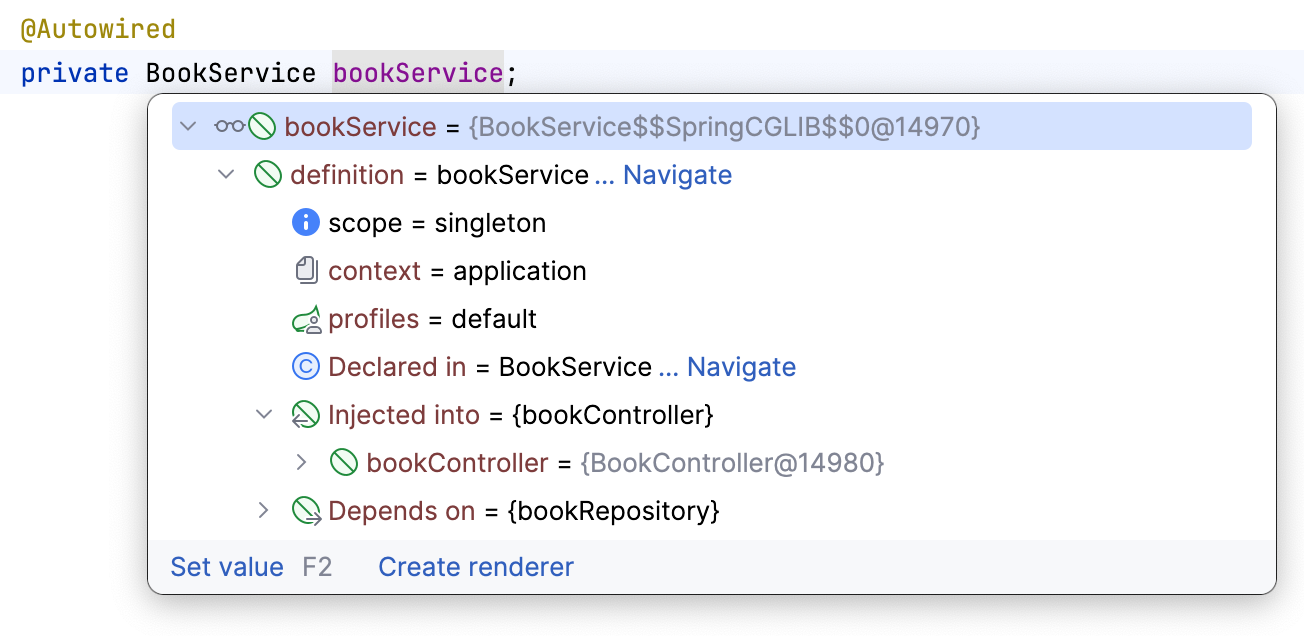
When evaluating an expression in IntelliJ IDEA's debugger, you have access to all properties and beans, regardless of whether they are present in the current execution context. This lets you execute methods of any bean to retrieve data and test hypotheses.
### Evaluate an expression from the editor / add a watch
Procedure:
* Hold `Alt` (Windows), `Alt` (macOS), `Alt` (IntelliJ IDEA Classic (macOS)), `Alt` (macOS System Shortcuts), `Alt` (XWin), `Alt` (GNOME), `Alt` (KDE), `Alt` (Emacs), `Alt` (Sublime Text), `Alt` (Sublime Text (macOS)), `Alt` (NetBeans), `Alt` (Visual Studio), `Alt` (Visual Studio (macOS)), `Alt` (Eclipse), `Alt` (Eclipse (macOS)) and click the expression you want to evaluate.
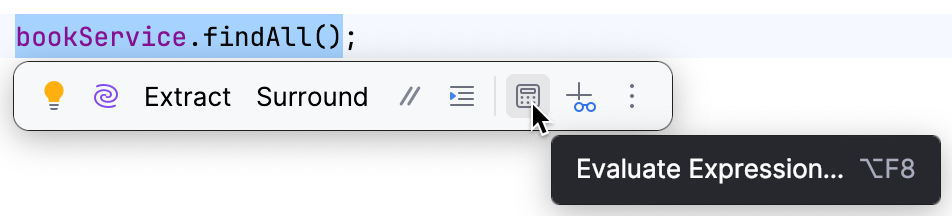
* Alternatively, select the expression then press `Ctrl+Alt+F8` (Windows), `⌘ ⌥ F8` (macOS), `⌘ ⌥ F8` (IntelliJ IDEA Classic (macOS)), `⌘ ⌥ F8` (macOS System Shortcuts), `Ctrl+Alt+8` (XWin), `Ctrl+Alt+8` (GNOME), `Ctrl+Alt+8` (KDE), `Ctrl+Alt+F8` (Emacs), `Ctrl+Alt+F8` (Sublime Text), `⌘ ⌥ F8` (Sublime Text (macOS)), `Ctrl+Alt+F8` (NetBeans), `Ctrl+Alt+F8` (Visual Studio), `⌘ ⌥ F8` (Visual Studio (macOS)), `Ctrl+Alt+F8` (Eclipse), `⌘ ⌥ F8` (Eclipse (macOS)) or select Evaluate Expression from the floating toolbar that appears.
You can add the expression to watches by clicking  in the toolbar.
> **Tip:**
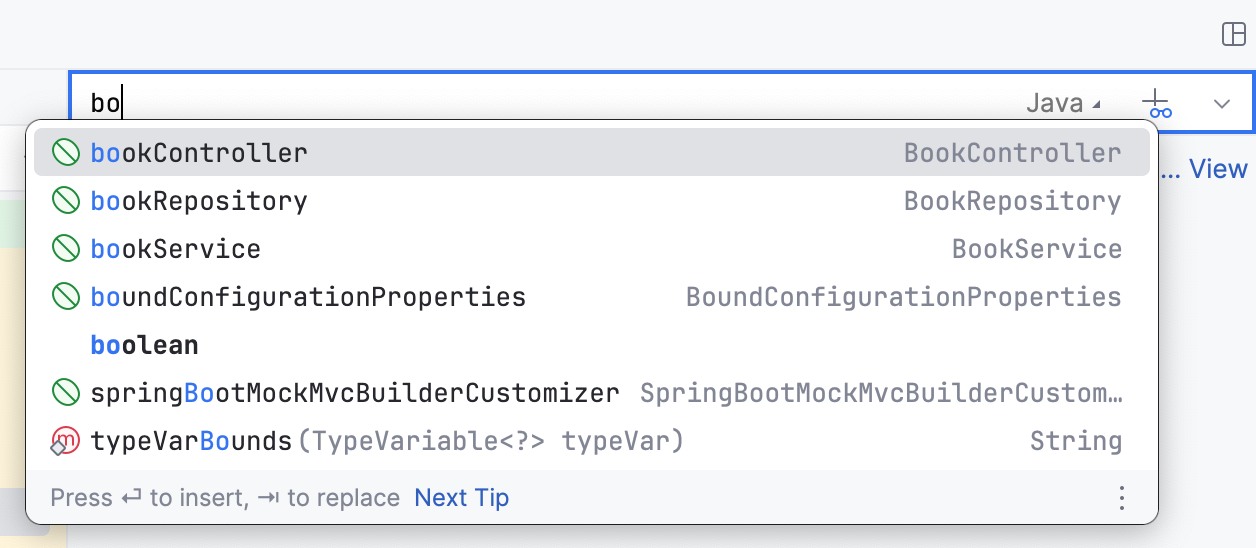
> Use [code completion](auto-completing-code.html) to insert symbols in expressions. This helps you avoid errors and write expressions more quickly.
>
>
>
> 
### Evaluate an arbitrary expression / add a watch
Procedure:
* To evaluate an arbitrary expression, enter it in the Evaluate expression field in the Variables tab and press `Enter` (Windows), `⏎` (macOS), `⏎` (IntelliJ IDEA Classic (macOS)), `⏎` (macOS System Shortcuts), `Enter` (XWin), `Enter` (GNOME), `Enter` (KDE), `Enter` (Emacs), `Enter` (Sublime Text), `⏎` (Sublime Text (macOS)), `Enter` (NetBeans), `Enter` (Visual Studio), `⏎` (Visual Studio (macOS)), `Enter` (Eclipse), `⏎` (Eclipse (macOS))
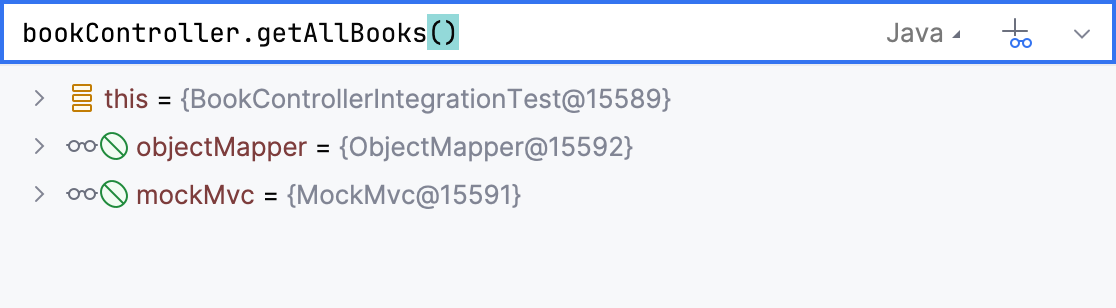
The result is displayed right below. You can also [add the expression to watches]() by clicking  in the right-hand part of the expression field.
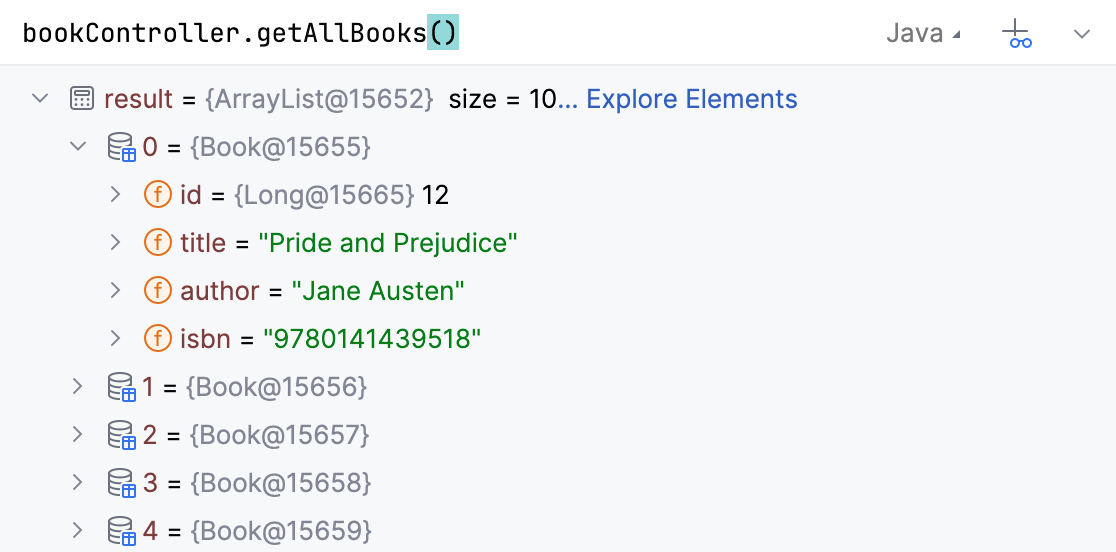
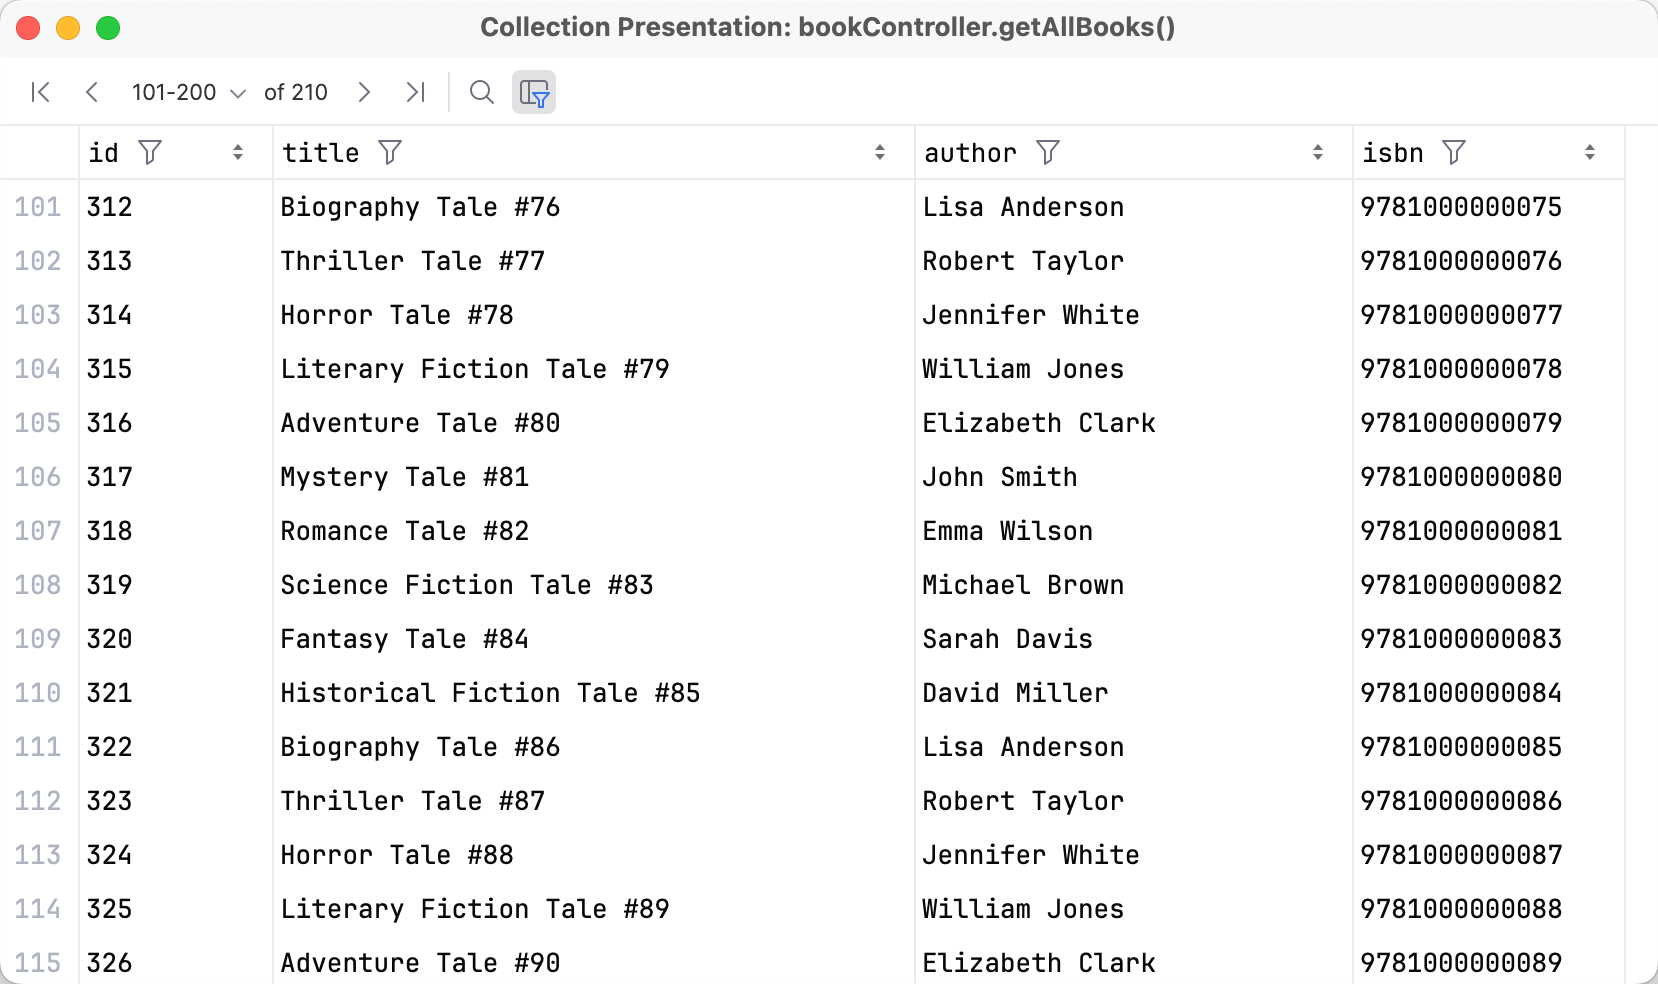
To view collections in a separate dialog, click Explore elements near the result row. This view paginates the results and lets you search and filter them.
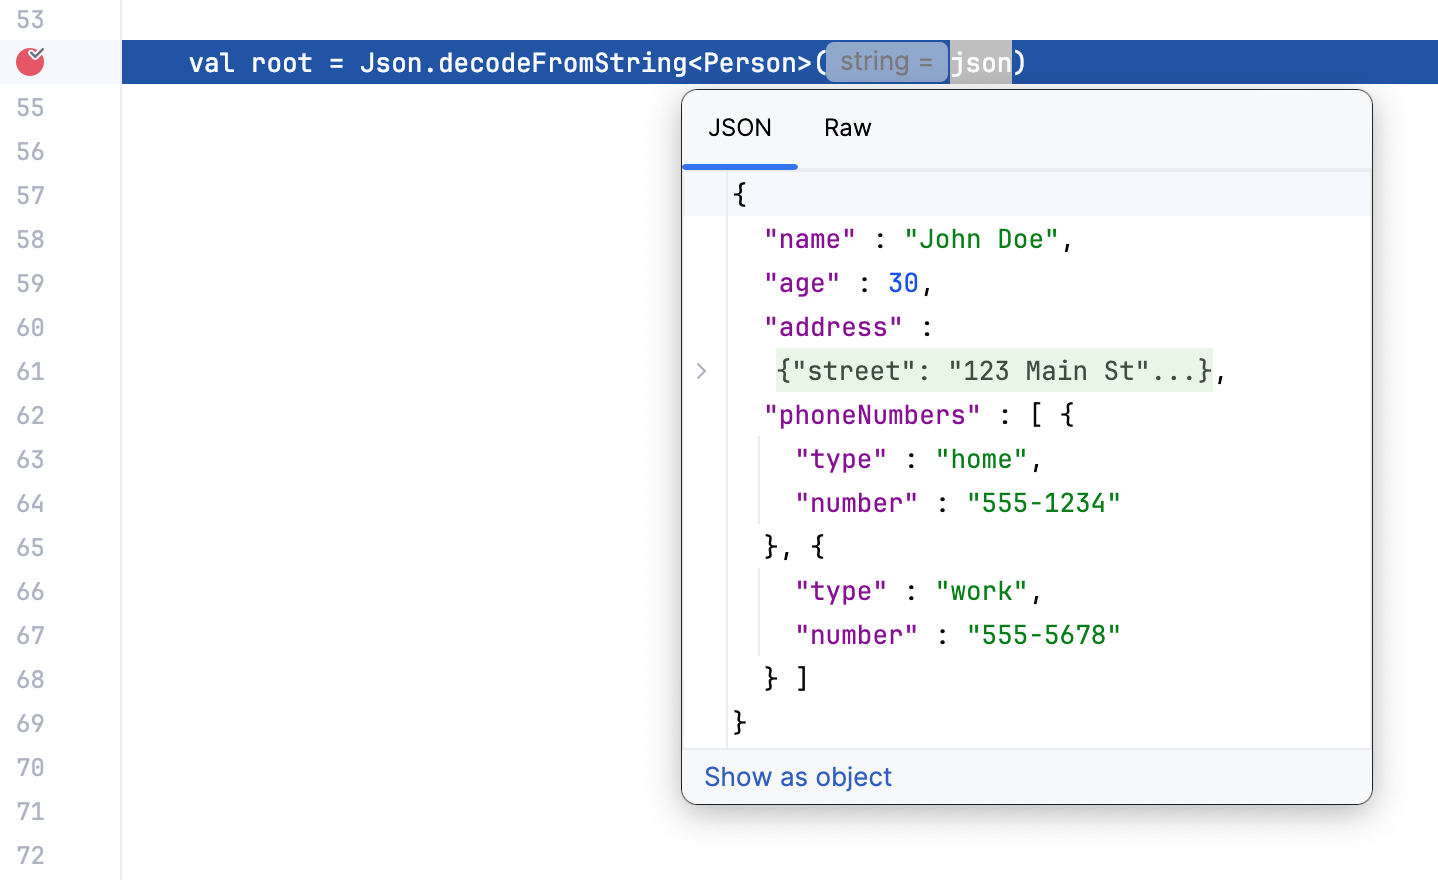
If the result of the expression is a JSON- or XML-formatted string, you can view it as a structured document. This lets you use editor features like [code folding](https://www.jetbrains.com/guide/java/tips/expand-collapse-code/) and [extend or shrink selection](https://www.jetbrains.com/guide/java/tips/extend-selection/) for working with subtrees and convenient navigation in big objects.
### Evaluate a Spring property
Procedure:
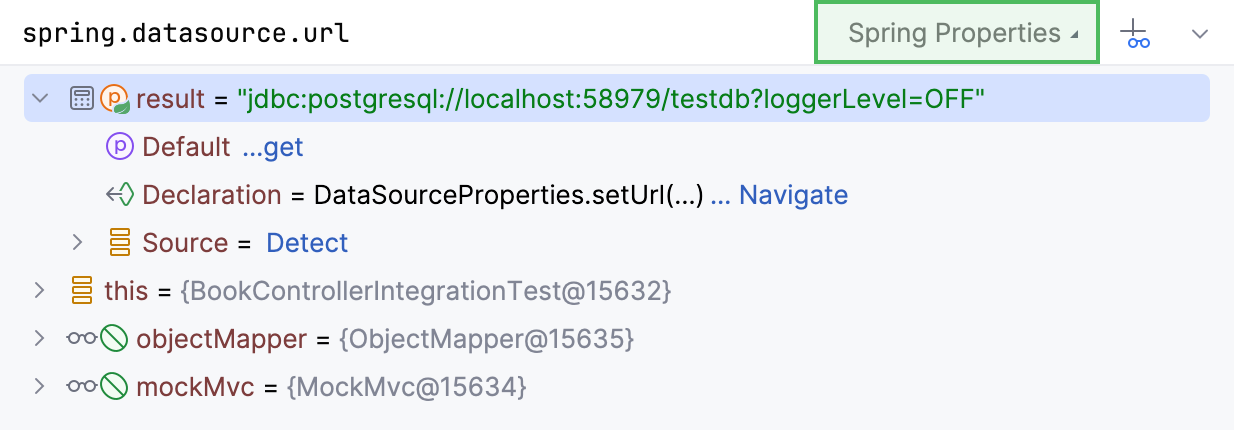
1. In the right-hand part of the expression field, select Spring Properties from the menu.
2. Enter the property that you want to evaluate and press `Enter` (Windows), `⏎` (macOS), `⏎` (IntelliJ IDEA Classic (macOS)), `⏎` (macOS System Shortcuts), `Enter` (XWin), `Enter` (GNOME), `Enter` (KDE), `Enter` (Emacs), `Enter` (Sublime Text), `⏎` (Sublime Text (macOS)), `Enter` (NetBeans), `Enter` (Visual Studio), `⏎` (Visual Studio (macOS)), `Enter` (Eclipse), `⏎` (Eclipse (macOS)). The property value and details appear under the result node.
If you want to set up a watch for this property, click  in the right-hand part of the expression field.
### Expressions in breakpoints
Similar to expressions and watches, you can use expressions in breakpoints. This lets you add temporary logging and suspend the application only when a condition is met.
Procedure: Set conditional breakpoints
* Right-click a [breakpoint](using-breakpoints.html) and enter the condition in the Condition field.
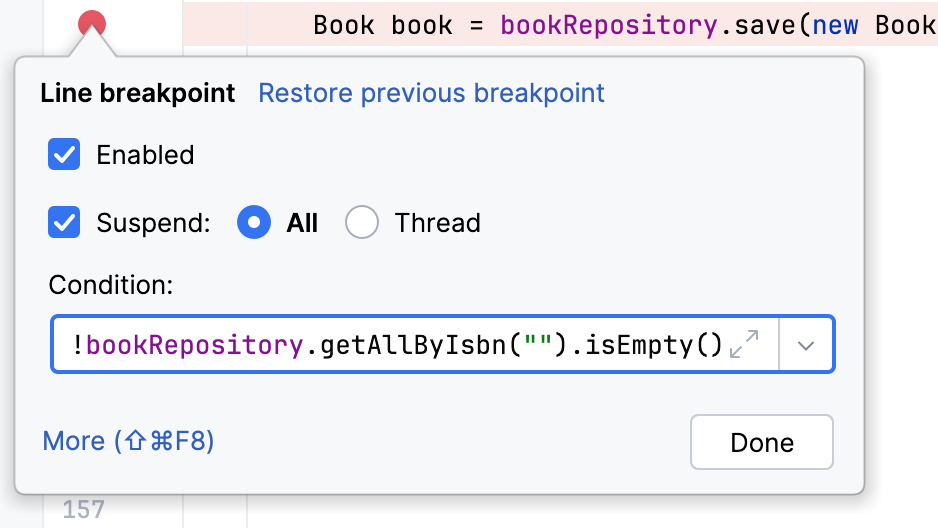
The breakpoint suspends the application only when the condition evaluates to `true`.
Procedure: Set logging breakpoints
* Right-click a [breakpoint](using-breakpoints.html), click More, and enter the logging expression in the Evaluate and log field.
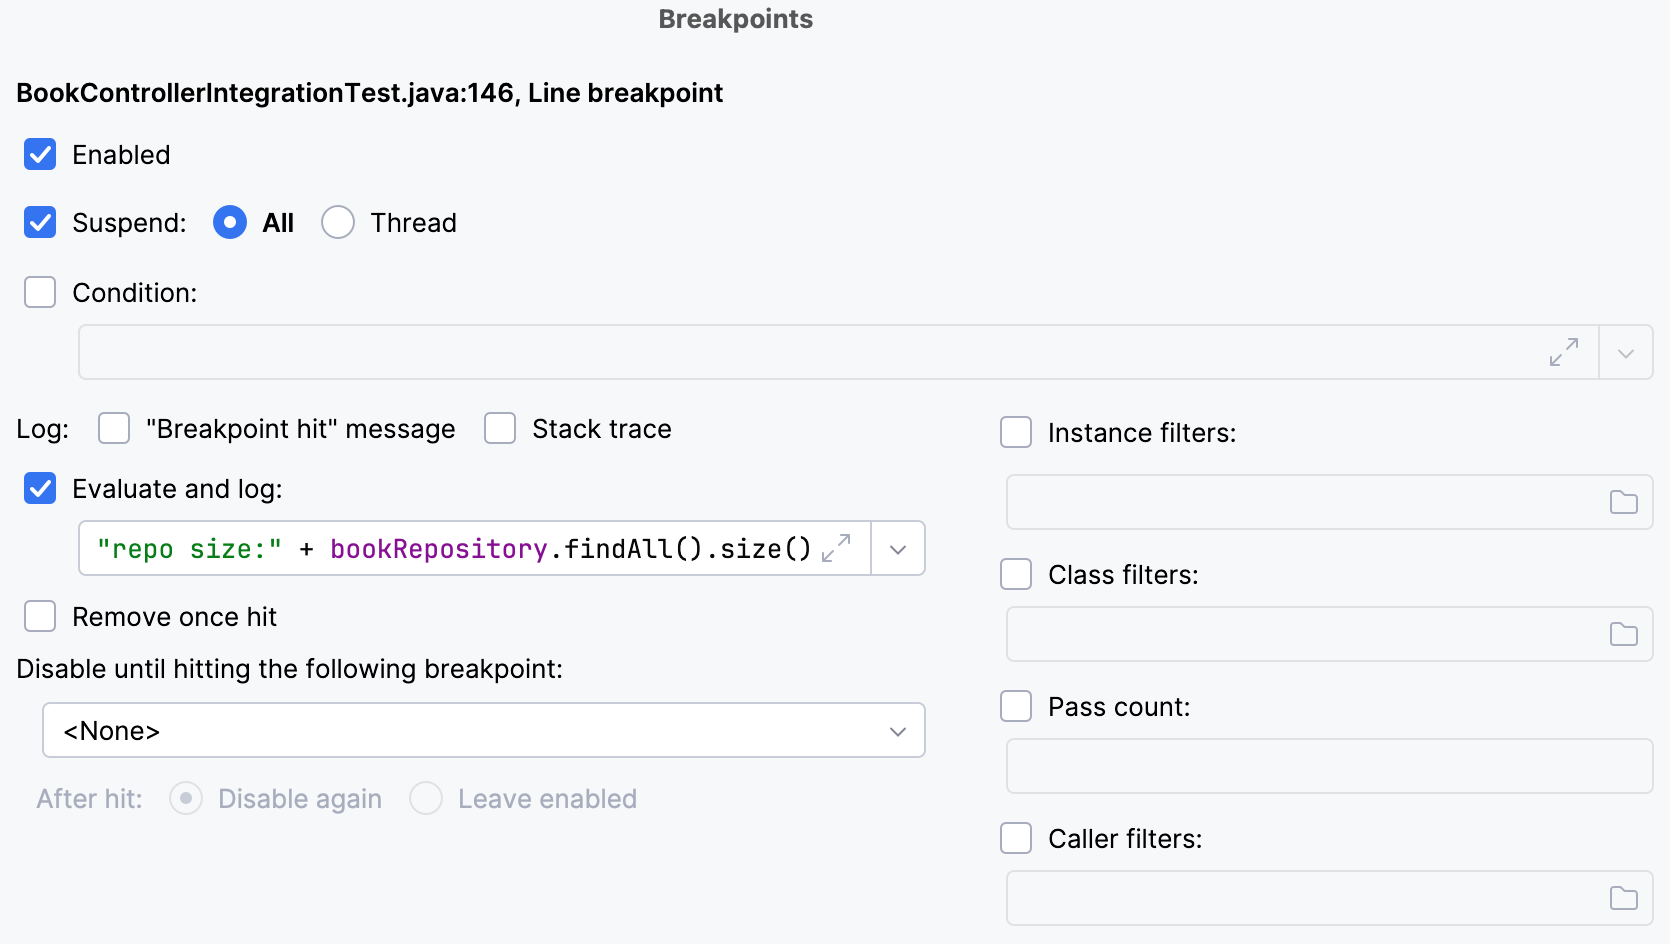
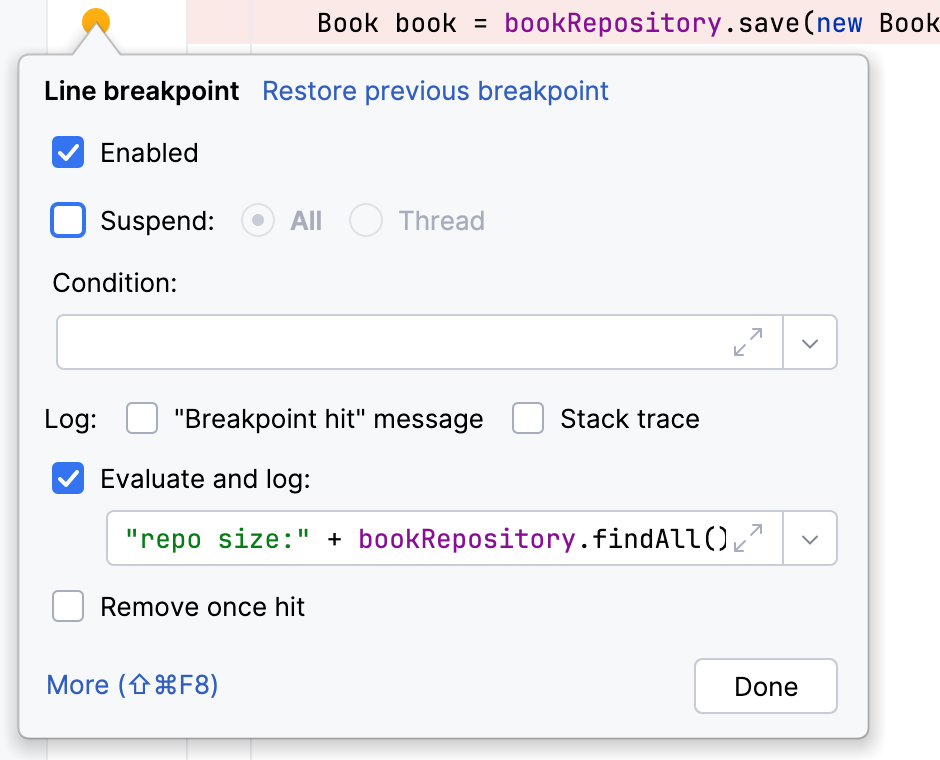
The breakpoint logs the expression result to the console in addition to suspending the application. To only log the expression without suspending the application, clear the Suspend checkbox.
For information on breakpoint types and filters, refer to the [Breakpoints](using-breakpoints.html) page.
## Review runtime information for a bean
You can review the runtime information of a bean directly from the editor.
Procedure:
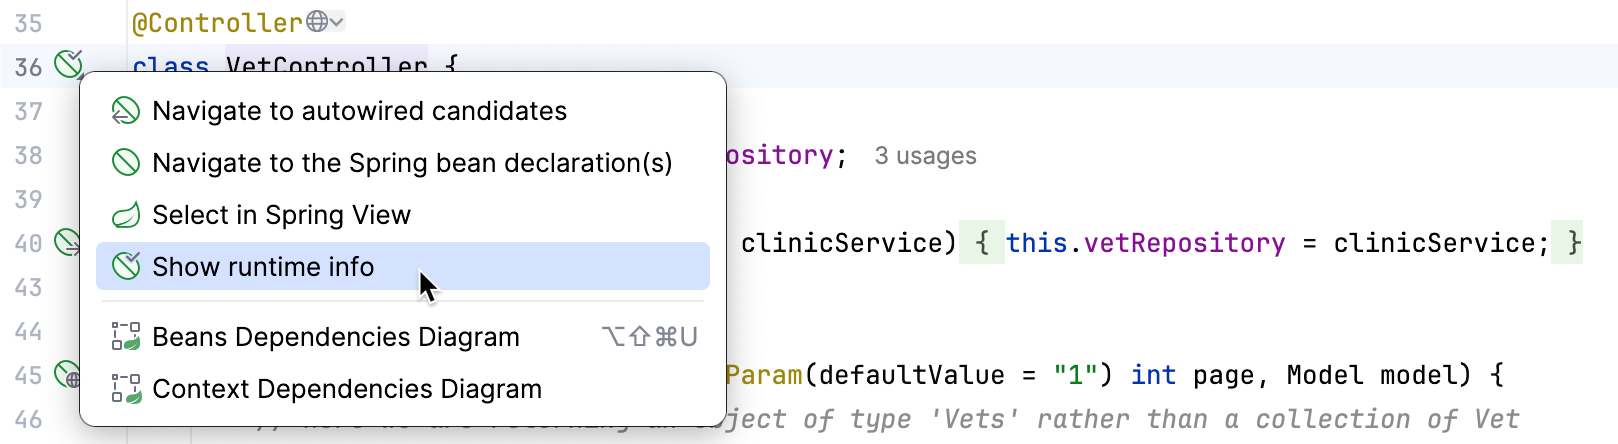
1. Click the gutter icon near the class definition of a loaded bean in the editor ().
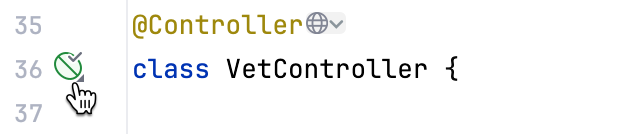
2. From the menu that appears, select Show runtime info.
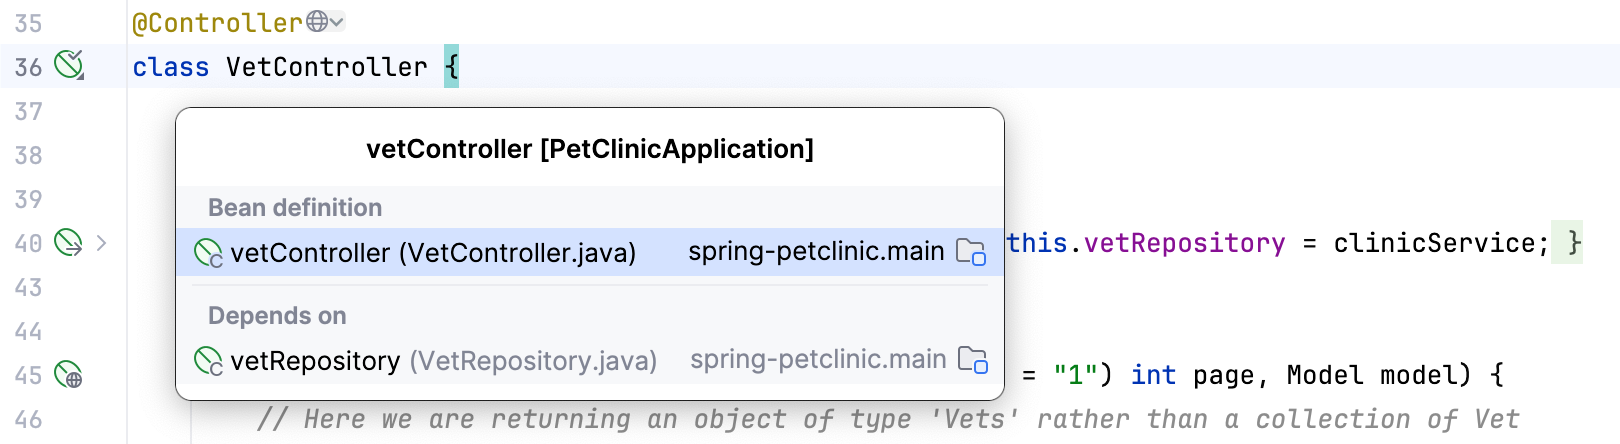
A popup with the following information appears:
* Injected into – other beans where this bean is currently injected
* Depends on – other beans that are injected into this one; the opposite of Injected into.
You can also view runtime information as inlay hints in the editor without needing to suspend the application. For each injected bean, the inlay hint shows which implementation is currently injected, along with additional information like scope, context, and profiles.
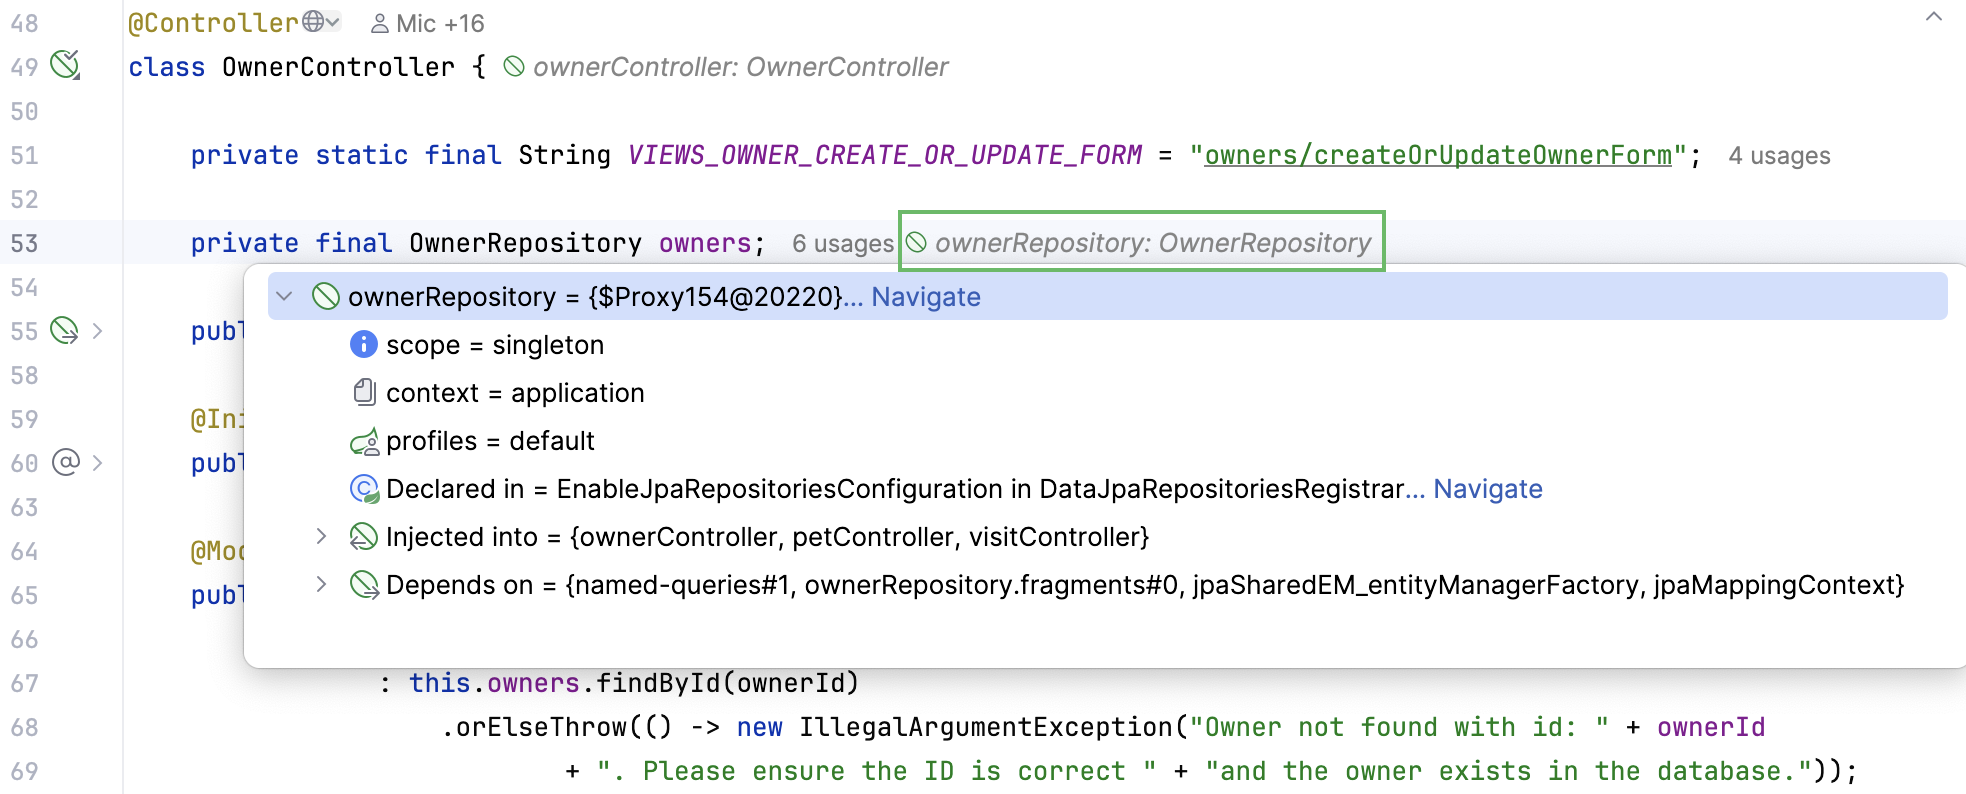
To find out where the injected bean comes from, click the inlay hint and IntelliJ IDEA will navigate you to the bean definition.
## Debug transactions
If the operation you are currently debugging takes place inside a JPA transaction, you can view the session context, including the transaction's isolation level, propagation status, and cache contents, directly in the debugger.
Procedure: View transaction details
1. Suspend your application at a line that executes within a transaction.
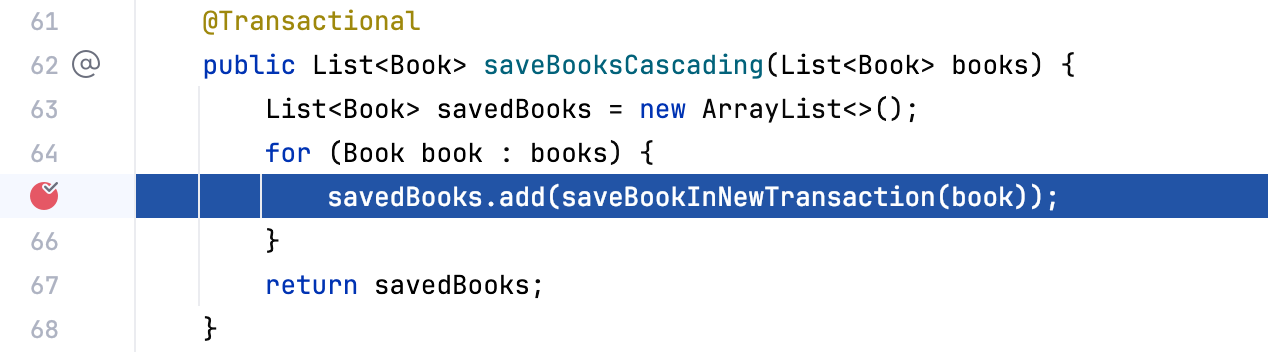
2. Open the Debug tool window and switch to the Variables tab. The transaction details are displayed under the transaction node.
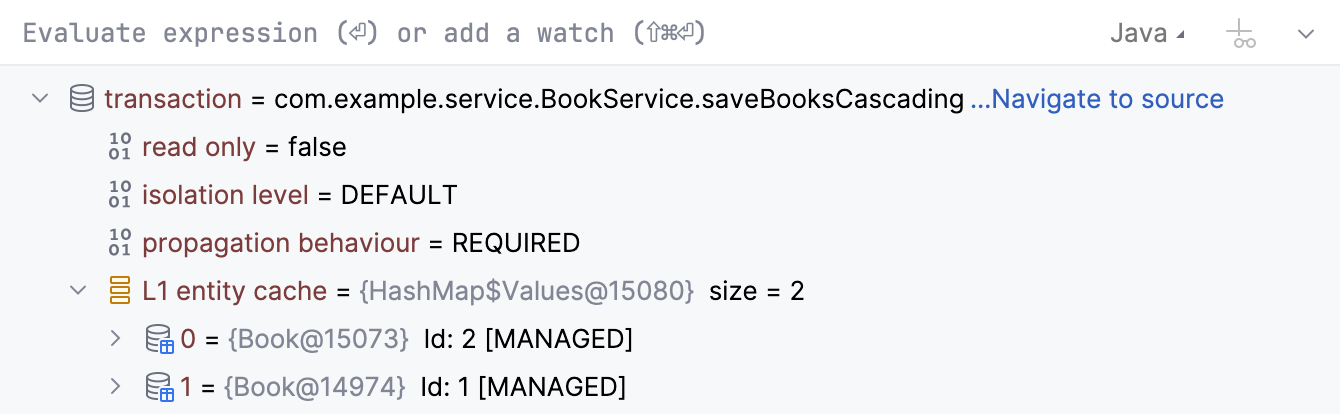
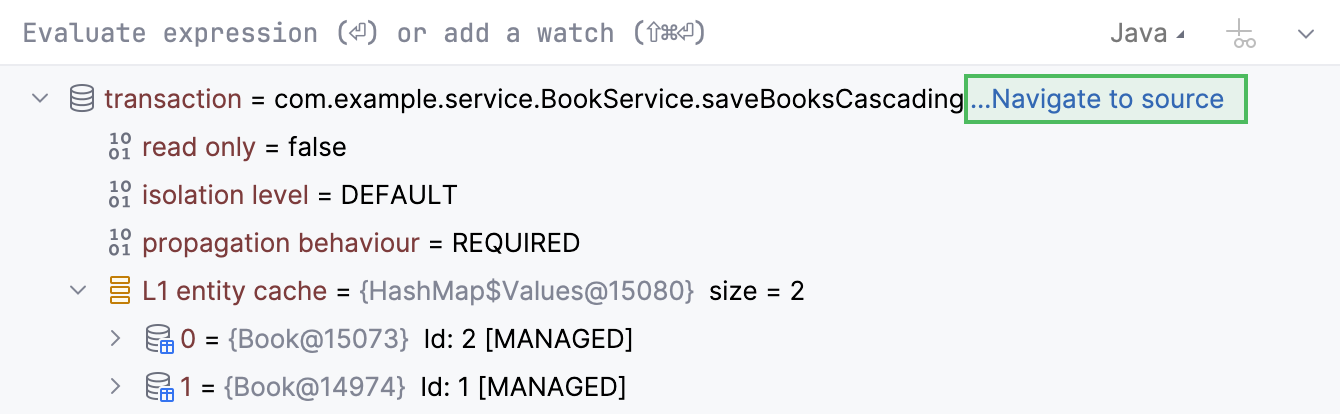
When in a transaction, you can also navigate to the place in the code where it was initiated.
Procedure: Navigate to the transaction source
* In the Variables tab, click Navigate to source
For JPA entities that are included in the transaction, you can review their current state in the Debug tool window's Variables tab and near the entity mentions in the code:

## Review loaded beans
When running a Spring application in debug mode, the Project tool window indicates the runtime status of each bean from the Spring point of view:
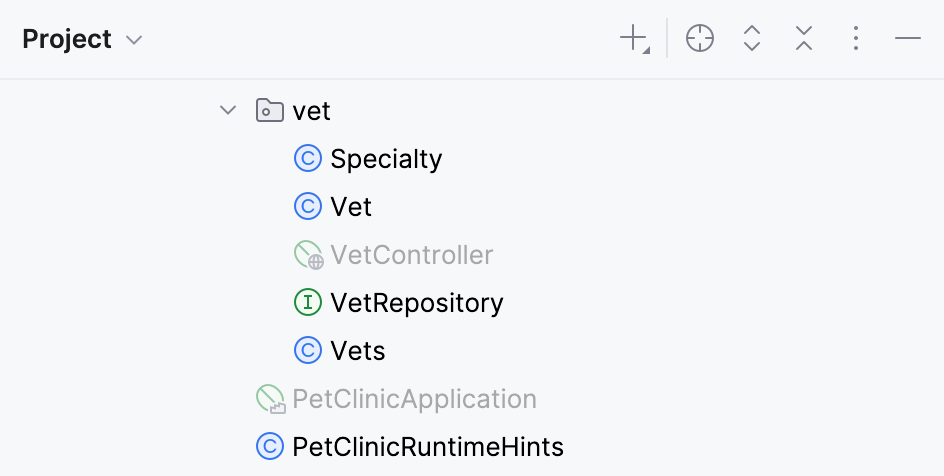
The icon colors indicate the following statuses:
* green – loaded
* transparent – not loaded
* yellow – mocked
Additionally, a bean can have one of the following icons:
* : auto-discoverable beans declared with `@Component` annotations as well as methods annotated with `@Bean`.
* : configuration beans (annotated with `@Configuration` or other annotations that implicitly include `@Configuration`).
* : repository beans (annotated with `@Repository` or extending the `org.springframework.data.repository.Repository` interface).
* : controllers (classes annotated with `@Controller` and `@RestController`).
* : implicit beans—that is, service beans added by Spring that are not defined explicitly.
* : abstract XML beans (defined with the `abstract="true"` attribute in XML files).
* : infrastructure beans—that is, beans defined in XML files related to the configuration and general infrastructure support, such as ViewResolver or beans with `context:component-scan`.
* : beans with the prototype scope (defined with the `scope="prototype"` in XML files).
* : other beans defined in XML files.
## Disable Spring Debugger
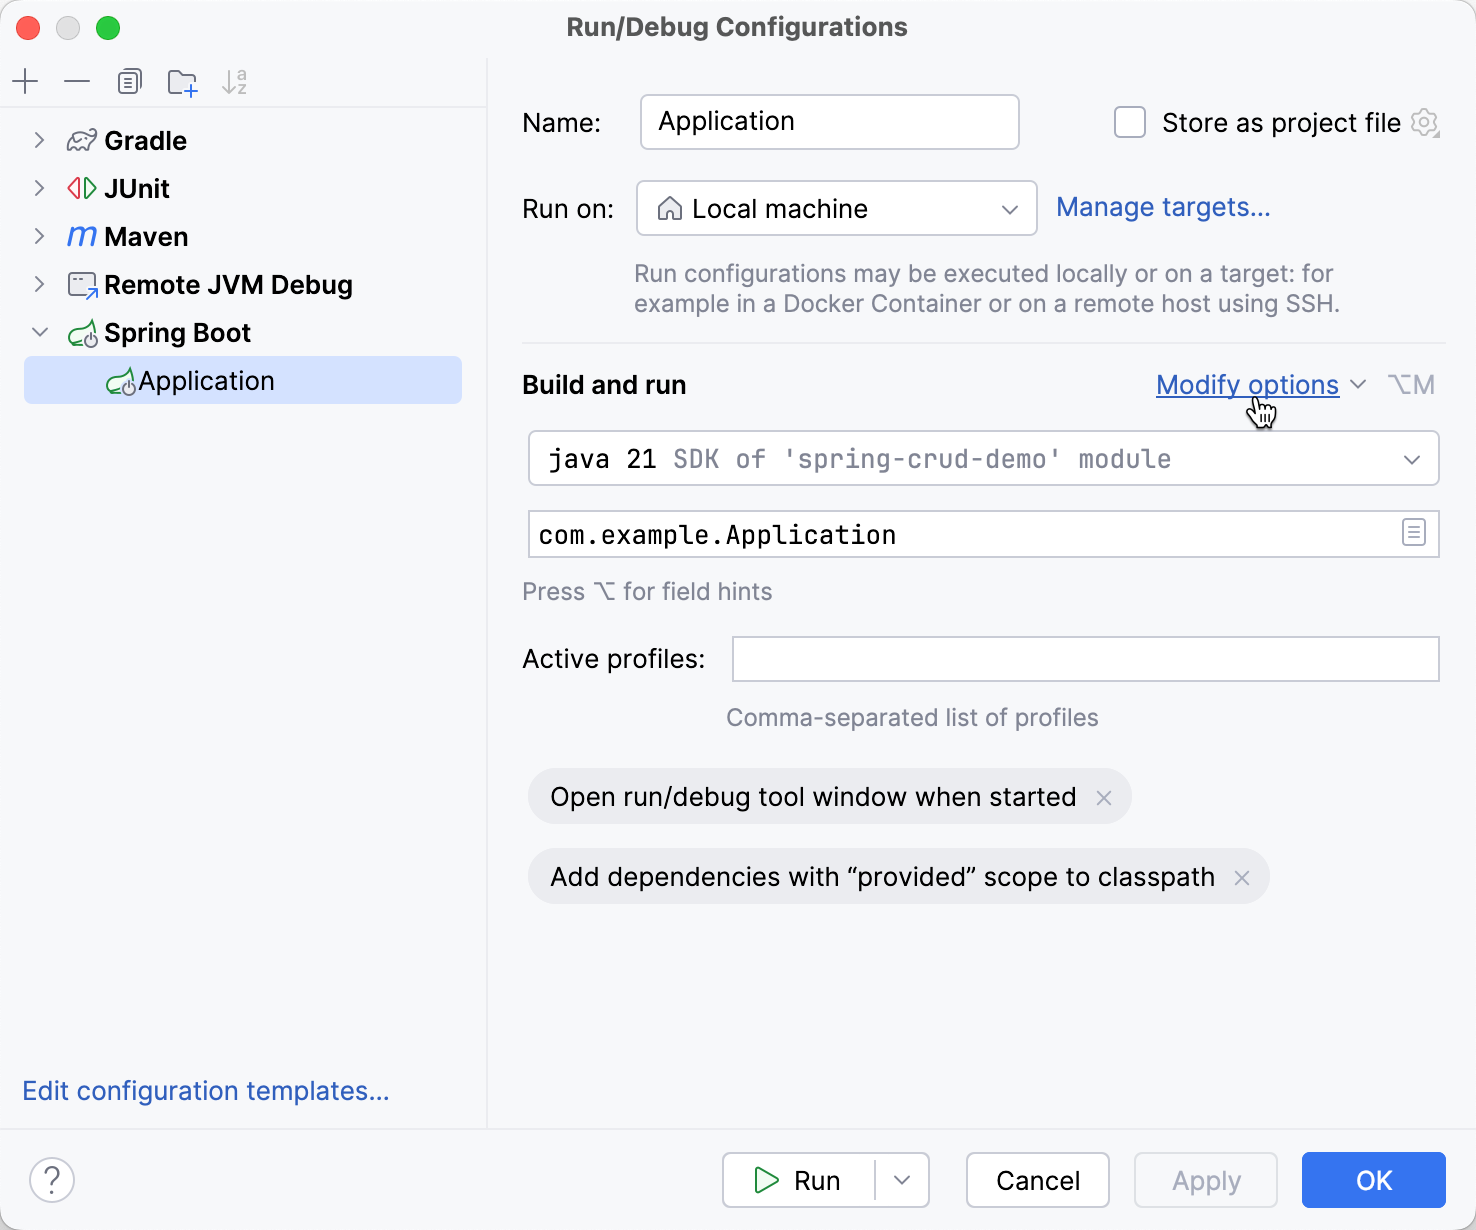
You can disable Spring Debugger features for a specific [run/debug configuration](run-debug-configuration.html).
Procedure:
* In the settings of a run/debug configuration, click Modify Options, then select Disable Spring Debugger.
## Debug remote Spring applications
Spring Debugger also supports debugging remote Spring applications running in the following embedded containers:
* Tomcat
* Jetty
* Undertow
> **Note:**
> In the case of remote debug, Spring debugger does not show the database structure view.
### Differences between containers
Because of different threading models in the supported containers, Spring Debugger might deliver the context with a delay:
* Tomcat – context available immediately
* Jetty – context available after a slight delay (until the first HTTP request)
* Undertow – context available after a slight delay (until the first HTTP request)
Procedure: Run a Spring application with the debug agent
* Launch your Spring application with the VM option that attaches the debug agent.
An example of providing the VM option through `JAVA_TOOL_OPTIONS` in a Docker Compose configuration:
```YAML
http-server:
depends_on:
- postgresql
image: 'jb/http-server:latest'
environment:
- SPRING_DATASOURCE_URL=jdbc:postgresql://postgresql:5432/db
- SPRING_DATASOURCE_USERNAME=user
- SPRING_DATASOURCE_PASSWORD=secret
- JAVA_TOOL_OPTIONS=-agentlib:jdwp=transport=dt_socket,server=y,suspend=n,address=*:5005
ports:
- '8080:8080'
- '5005:5005' # Map debug port 5005 to host port 5005
```
> **Note:**
> Make sure the debug port is exposed correctly as shown in the example above.
For more information on the VM option, refer to [Debug agent](attach-to-process.html#debug-agent)
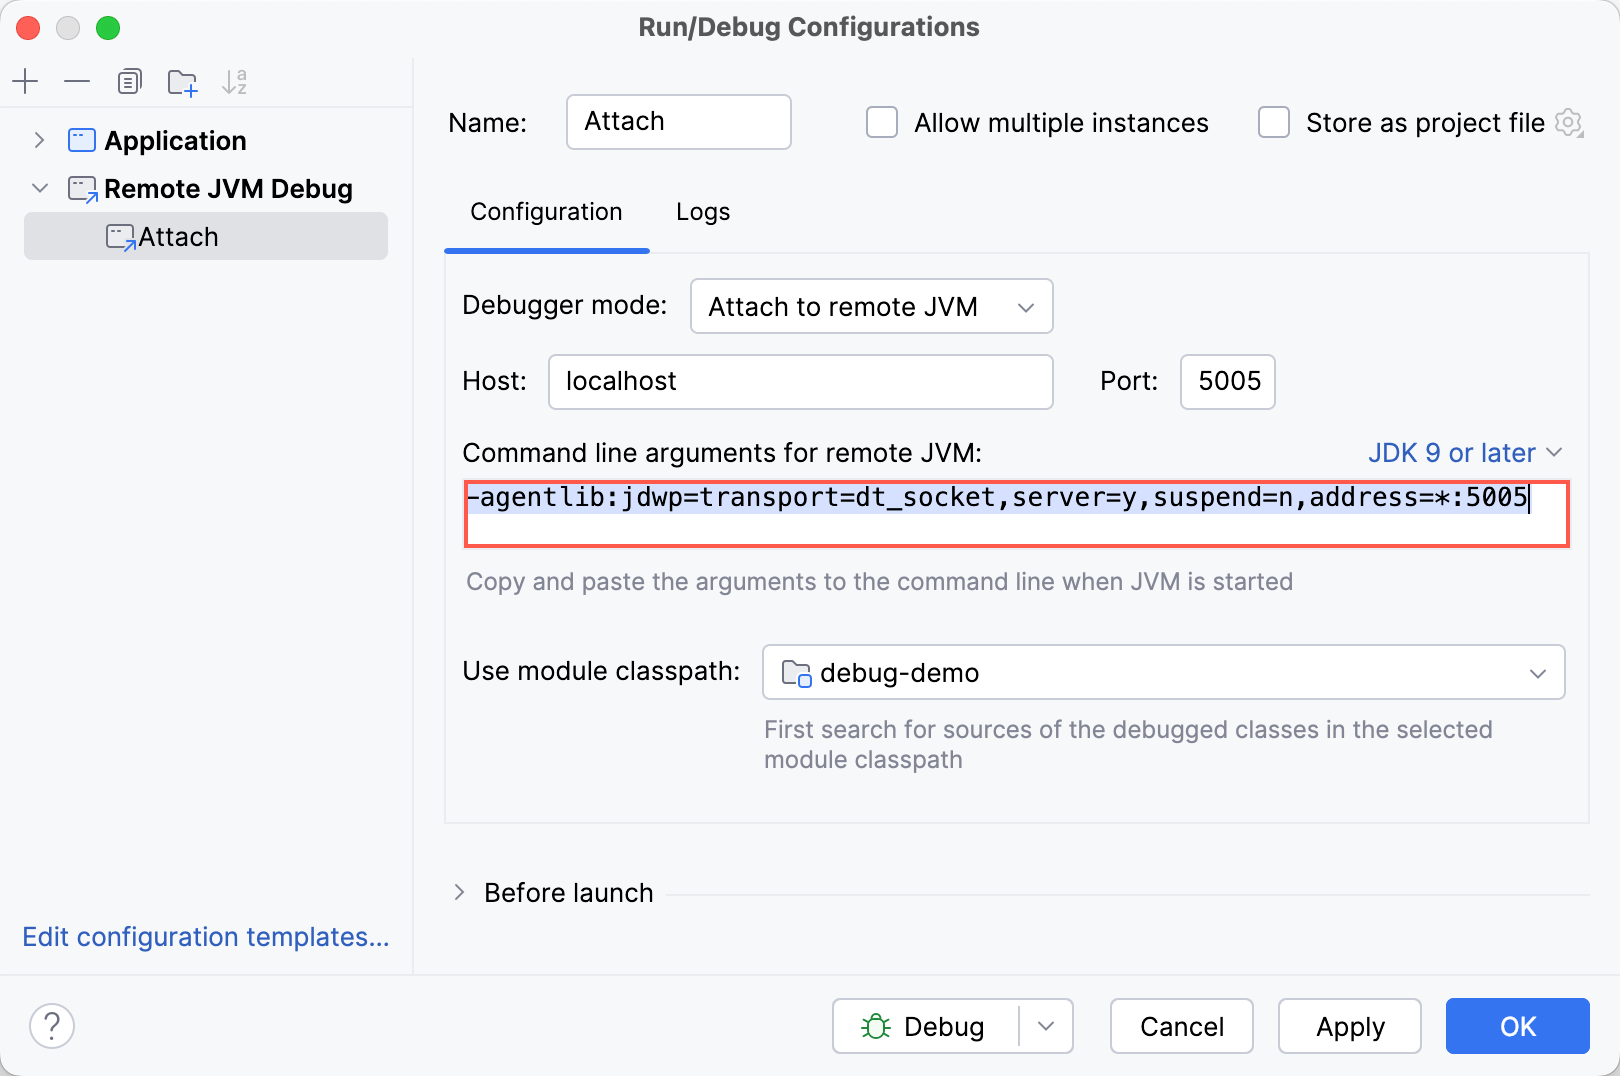
Procedure: Create a run/debug configuration
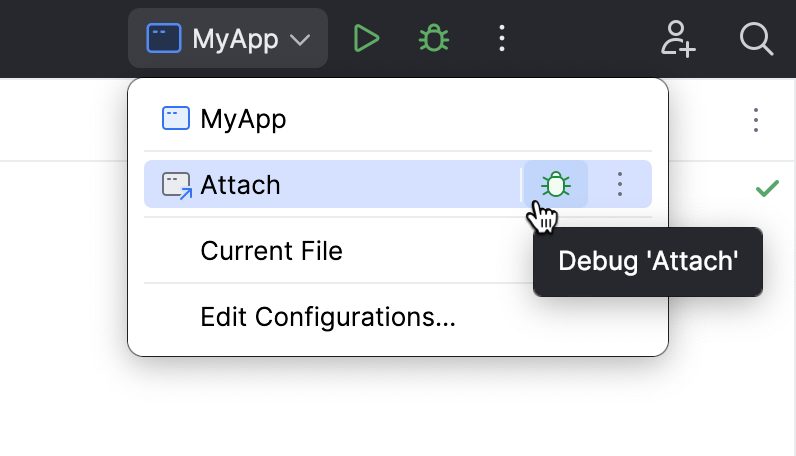
1. Go to `Run | Edit Configurations`. Alternatively, press `Alt+Shift+F10` (Windows), `⌃ ⌥ R` (macOS), `⌥ ⇧ F10` (IntelliJ IDEA Classic (macOS)), `⌃ ⌥ R` (macOS System Shortcuts), `Alt+Shift+F10` (XWin), `Alt+Shift+F10` (GNOME), `Alt+Shift+F10` (KDE), `Alt+Shift+F10` (Emacs), `Alt+Shift+F10` (Sublime Text), `⌃ ⌥ R` (Sublime Text (macOS)), `Alt+Shift+F10` (NetBeans), `Ctrl+Alt+Shift+R` (Visual Studio), `⌘ ⌥ ⇧ R` (Visual Studio (macOS)), `Alt+Shift+F10` (Eclipse), `⌃ ⌥ R` (Eclipse (macOS)), then `0` (Windows), `0` (macOS), `0` (IntelliJ IDEA Classic (macOS)), `0` (macOS System Shortcuts), `0` (XWin), `0` (GNOME), `0` (KDE), `0` (Emacs), `0` (Sublime Text), `0` (Sublime Text (macOS)), `0` (NetBeans), `0` (Visual Studio), `0` (Visual Studio (macOS)), `0` (Eclipse), `0` (Eclipse (macOS)).
2. In the [Run/Debug Configuration](run-debug-configurations-dialog.html) dialog, click  on the toolbar or press `Alt+Insert` (Windows), `⌘ N` (macOS), `⌃ N` (IntelliJ IDEA Classic (macOS)), `⌘ N` (macOS System Shortcuts), `Alt+Insert` (XWin), `Alt+Insert` (GNOME), `Alt+Insert` (KDE), `Alt+Insert` (Emacs), `Ctrl+N` (Sublime Text), `⌘ N` (Sublime Text (macOS)), `Alt+Insert` (NetBeans), `Ctrl+N` (Visual Studio), `⌘ N` (Visual Studio (macOS)), `Alt+Insert` (Eclipse), `⌘ N` (Eclipse (macOS)). Select Remote JVM debug from the list.
3. In Debugger mode, specify whether the debugger should connect to the remote JVM or listen for incoming connections.
> **Note:**
> Make sure that the selected Debugger mode is consistent with the VM option for the remote JVM. For example, if the remote JVM is listening (acts as a server), the debugger has to attach (act as a client).
If you choose Listen to remote JVM, specify whether you want to automatically restart the debugger after the remote JVM has disconnected. This way, the debugger will always be ready to handle incoming connections.
4. (for Windows) Optionally, specify the desired [transport](https://docs.oracle.com/javase/7/docs/technotes/guides/jpda/conninv.html#Transports). IntelliJ IDEA selects the appropriate transport automatically, so you don't need to configure it unless you have special requirements regarding the communication method.
5. Specify the host and the port of the remote JVM. Both IPv4 and IPv6 are supported. Make sure that the port is specified correctly, is not in use, and not blocked by a firewall.
6. Specify the module to look for the sources. IntelliJ IDEA will first check the selected module, then the other modules, if any. Sources are matched using fully-qualified class names. If there is no match by the fully-qualified name, IntelliJ IDEA tries to find a match by the file name.
7. Optionally, configure logging. For log settings, refer to [Logs](setting-log-options.html).
8. If you haven't yet configured the debug agent for the debuggee JVM, you can copy the required VM option from the Command line arguments for remote JVM field.
Procedure: Start the run/debug configuration
1. Make sure that the host application is up and running and has been started with the [VM option that adds the debug agent](#debug-agent).
2. [Launch](starting-the-debugger-session.html) the run/debug configuration [you created
earlier](#create-rc).