# Step through the program
> **TL;DR**
> Step Over: `F8` (Windows), `F8` (macOS), `F8` (IntelliJ IDEA Classic (macOS)), `⌘ Quote` (macOS System Shortcuts), `F8` (XWin), `F8` (GNOME), `F8` (KDE), `F8` (Emacs), `F8` (Sublime Text), `F8` (Sublime Text (macOS)), `F8` (NetBeans), `F10` (Visual Studio), `F10` (Visual Studio (macOS)), `F6` (Eclipse), `F6` (Eclipse (macOS))
>
>
>
> Step Into: `F7` (Windows), `F7` (macOS), `F7` (IntelliJ IDEA Classic (macOS)), `⌘ ;` (macOS System Shortcuts), `F7` (XWin), `F7` (GNOME), `F7` (KDE), `F7` (Emacs), `F7` (Sublime Text), `F7` (Sublime Text (macOS)), `F7` (NetBeans), `F11` (Visual Studio), `⌘ F11` (Visual Studio (macOS)), `F5` (Eclipse), `F5` (Eclipse (macOS))
Stepping is the process of controlling step-by-step execution of the program.
After you have [started](starting-the-debugger-session.html) the debugging session and [suspended your program](using-breakpoints.html), IntelliJ IDEA provides you with a set of stepping actions. The choice of a particular stepping action depends on your strategy, such as whether you need to go directly to the next line or [inspect](examining-suspended-program.html) the intermediate method calls as well.
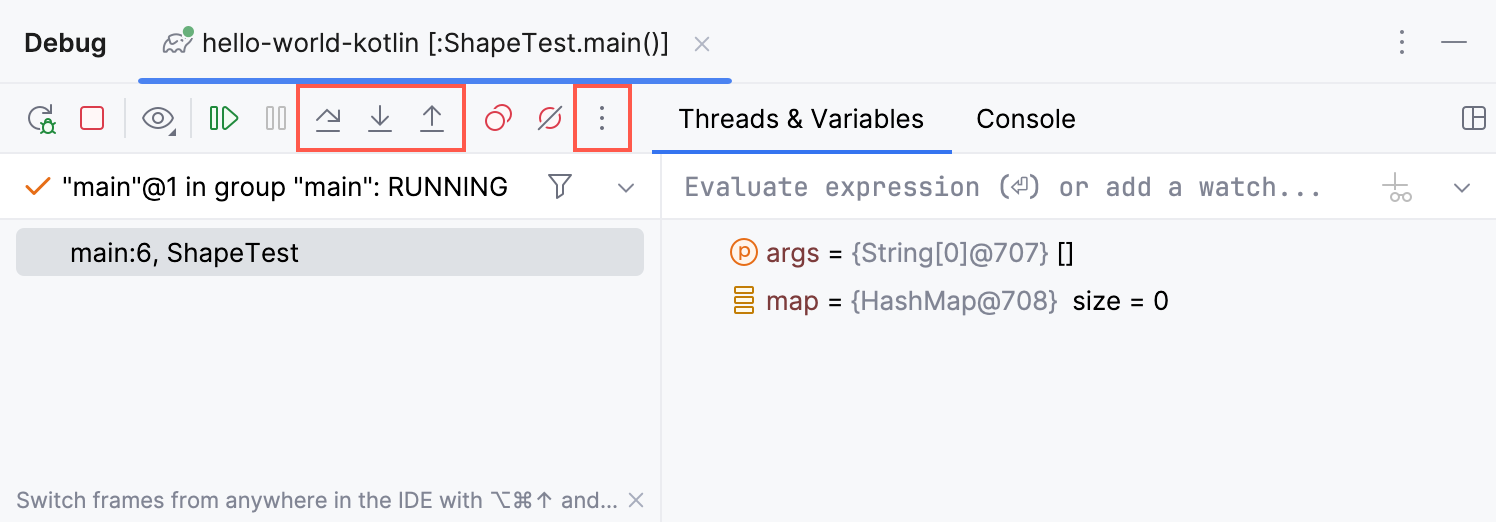
The stepping buttons are located on the Debug tool window [toolbar](debug-tool-window.html#Toolbar).
## Step over
> **TL;DR**
> Click the Step Over button  or press `F8` (Windows), `F8` (macOS), `F8` (IntelliJ IDEA Classic (macOS)), `⌘ Quote` (macOS System Shortcuts), `F8` (XWin), `F8` (GNOME), `F8` (KDE), `F8` (Emacs), `F8` (Sublime Text), `F8` (Sublime Text (macOS)), `F8` (NetBeans), `F10` (Visual Studio), `F10` (Visual Studio (macOS)), `F6` (Eclipse), `F6` (Eclipse (macOS)).
Steps over the current line of code and takes you to the next line even if the highlighted line has method calls in it. The implementation of the methods is skipped, and you move straight to the next line of the caller method.
```JAVA
public static void main(String[] args) {
// the program is suspended here
count(10);
System.out.printIn("Count complete!");
}
```
In the example, line 5 is about to be executed. If you step over, the debugger will move straight to line 6 without visiting the `count()` method.
```JAVA
public static void main(String[] args) {
count(10);
// execution point moves here after Step Over
System.out.printIn("Count complete!");
}
```
If there are breakpoints inside the skipped methods, the debugger will stop at them. To skip any breakpoints on the way, use [Force step over](#force-step-over).
## Step into
> **TL;DR**
> Click the Step Into button  or press `F7` (Windows), `F7` (macOS), `F7` (IntelliJ IDEA Classic (macOS)), `⌘ ;` (macOS System Shortcuts), `F7` (XWin), `F7` (GNOME), `F7` (KDE), `F7` (Emacs), `F7` (Sublime Text), `F7` (Sublime Text (macOS)), `F7` (NetBeans), `F11` (Visual Studio), `⌘ F11` (Visual Studio (macOS)), `F5` (Eclipse), `F5` (Eclipse (macOS)).
Enters the method to show what happens inside it.
```JAVA
public static void main(String[] args) {
// the program is suspended here
count(10);
System.out.printIn("Count complete!");
}
```
```JAVA
private static void count(int to) {
// after Step Into, the program enters the count() method and
for (int i = 0; i < 10; i++) {
System.out.println(i);
}
}
```
If there are several method calls on the line, IntelliJ IDEA asks you which method to enter. This feature is called [Smart step into](#smart-step-into).
You can configure Smart Step Into to be automatically used every time when there are multiple method calls on the line. Alternatively, it can be invoked only when you [expressly do so](#smart-step-into). To configure this feature, go to `Settings | Build, Execution, Deployment | Debugger | Stepping` and set the Always do smart step into option as required.
Some methods (for example, methods of standard Java classes like `System`) are skipped by Step into as you normally might not need to debug them. This list can be fine-tuned on the `Build, Execution, Deployment | Debugger | Stepping` page of the Settings dialog (`Ctrl+Alt+S` (Windows), `⌘ Comma` (macOS), `⌘ Comma` (IntelliJ IDEA Classic (macOS)), `⌘ Comma` (macOS System Shortcuts), `Ctrl+Alt+S` (XWin), `Ctrl+Alt+S` (GNOME), `Ctrl+Alt+S` (KDE), `Ctrl+Alt+S` (Emacs), `Ctrl+Alt+S` (Sublime Text), `⌘ Comma` (Sublime Text (macOS)), `Ctrl+Alt+S` (NetBeans), `Ctrl+Alt+S` (Visual Studio), `⌘ Comma` (Visual Studio (macOS)), `Ctrl+Alt+S` (Eclipse), `⌘ Comma` (Eclipse (macOS))).
## Smart step into
Smart step into is helpful when there are several method calls on a line, and you want to be specific about which method to enter. This feature allows you to select the method call you are interested in.
Procedure:
1. Select Smart Step Into from the  menu or press `Shift+F7` (Windows), `⇧ F7` (macOS), `⇧ F7` (IntelliJ IDEA Classic (macOS)), `⌘ ⌥ ;` (macOS System Shortcuts), `Shift+F7` (XWin), `Shift+F7` (GNOME), `Shift+F7` (KDE), `Shift+F7` (Emacs), `Shift+F7` (Sublime Text), `⇧ F7` (Sublime Text (macOS)), `Shift+F7` (NetBeans), `Shift+F7` (Visual Studio), `⇧ F7` (Visual Studio (macOS)), `Ctrl+F5` (Eclipse), `⌥ F5` (Eclipse (macOS)).
2. Click the method. Alternatively, select the method using the arrow keys or the tab key, and then confirm the selection by pressing either `Enter` (Windows), `⏎` (macOS), `⏎` (IntelliJ IDEA Classic (macOS)), `⏎` (macOS System Shortcuts), `Enter` (XWin), `Enter` (GNOME), `Enter` (KDE), `Enter` (Emacs), `Enter` (Sublime Text), `⏎` (Sublime Text (macOS)), `Enter` (NetBeans), `Enter` (Visual Studio), `⏎` (Visual Studio (macOS)), `Enter` (Eclipse), `⏎` (Eclipse (macOS)) or `F7` (Windows), `F7` (macOS), `F7` (IntelliJ IDEA Classic (macOS)), `⌘ ;` (macOS System Shortcuts), `F7` (XWin), `F7` (GNOME), `F7` (KDE), `F7` (Emacs), `F7` (Sublime Text), `F7` (Sublime Text (macOS)), `F7` (NetBeans), `F11` (Visual Studio), `⌘ F11` (Visual Studio (macOS)), `F5` (Eclipse), `F5` (Eclipse (macOS)).

You can configure Smart Step Into to be used instead of the regular Step Into every time there are multiple method calls on the line. This is done in `Settings | Build, Execution, Deployment | Debugger | Stepping`.
## Step out
> **TL;DR**
> Click the Step Out button  or press `Shift+F8` (Windows), `⇧ F8` (macOS), `⇧ F8` (IntelliJ IDEA Classic (macOS)), `⌘ \` (macOS System Shortcuts), `Shift+F8` (XWin), `Shift+F8` (GNOME), `Shift+F8` (KDE), `Shift+F8` (Emacs), `Shift+F8` (Sublime Text), `⇧ F8` (Sublime Text (macOS)), `Ctrl+F7` (NetBeans), `Shift+F11` (Visual Studio), `⇧ F11` (Visual Studio (macOS)), `F7` (Eclipse), `F7` (Eclipse (macOS)).
Steps out of the current method and takes you to the caller method.
```JAVA
private static void count(int to) {
// the program is suspended here
for (int i = 0; i < 10; i++) {
System.out.println(i);
}
}
```
```JAVA
public static void main(String[] args) {
count(10);
// after Step Out, the program exits the count() method
System.out.printIn("Count complete!");
}
```
## Step out of code block
> **TL;DR**
> Select Step Out of Code Block from the  menu.
Steps out of the currently executed code block, such as an `if` statement or a `for` loop, without exiting the enclosing method.
```JAVA
static void count(int to) {
for (int i = 0; i < to; i++) {
// the program is suspended here
System.out.println(i);
}
System.out.println("Complete!");
}
```
In the example, the action exits the `for` loop. Note that the loop is executed anyway, and it would print all the numbers to the console as if we had stepped through each iteration.
```JAVA
static void count(int to) {
for (int i = 0; i < to; i++) {
System.out.println(i);
}
// Step Out of Code Block takes us here
System.out.println("Complete!");
}
```
## Run to cursor
Continues the execution until the position of the caret is reached.
Procedure:
1. Place the caret at the line where you want the program to pause.
2. Select Run to Cursor from the  menu or press `Alt+F9` (Windows), `⌥ F9` (macOS), `⌥ F9` (IntelliJ IDEA Classic (macOS)), `⌃ ⇧ \` (macOS System Shortcuts), `Alt+Shift+9` (XWin), `Alt+Shift+9` (GNOME), `Alt+Shift+9` (KDE), `Alt+F9` (Emacs), `Alt+F9` (Sublime Text), `⌥ F9` (Sublime Text (macOS)), `F4` (NetBeans), `Ctrl+F10` (Visual Studio), `⌘ F10` (Visual Studio (macOS)), `Ctrl+R` (Eclipse), `⌘ R` (Eclipse (macOS)).
Also, you can Run to Cursor by hovering over the line and clicking the Run to Cursor icon.
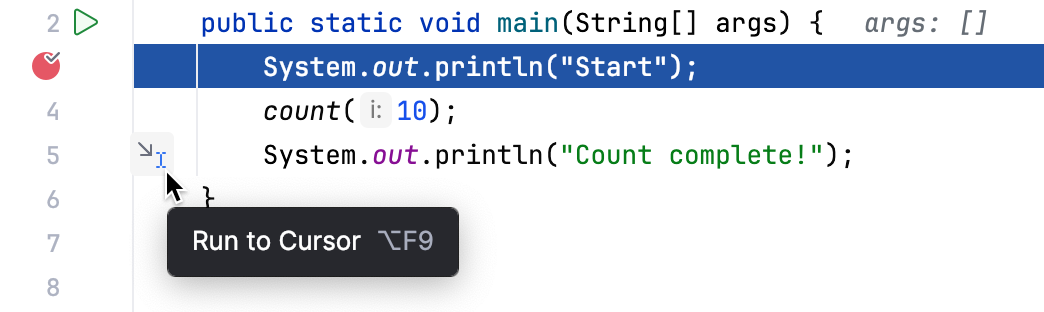
You can configure whether you want Run to Cursor to work on clicking a line number in `Settings | Build, Execution, Deployment | Debugger`.
In the example, Run to Cursor will continue the execution and stop after the `count()` method as if there were a breakpoint. If there are actual breakpoints in the skipped code, the program will be suspended upon reaching them.
To skip any breakpoints on the way, use [Force run to cursor](#force-run-to-cursor).
In the case of multithreaded execution, Run to Cursor attempts to keep stepping in the current thread or coroutine. If a different thread hits the target line before the original thread, IntelliJ IDEA will hold the later thread and wait 1 second for the original thread to catch up. After the timeout, IntelliJ IDEA will suspend the program in that later thread and notify you about it. If more threads or coroutines reach the destination, Run to Cursor defaults to waiting for the current thread and resumes the thread that was suspended earlier.
### Measure execution time with Run to Cursor
When you use Run to Cursor, it records the execution time for the skipped code fragment and labels each line in the gutter. You can use the labels to navigate to the methods' implementations, whose lines will also be marked with the same type of performance labels.
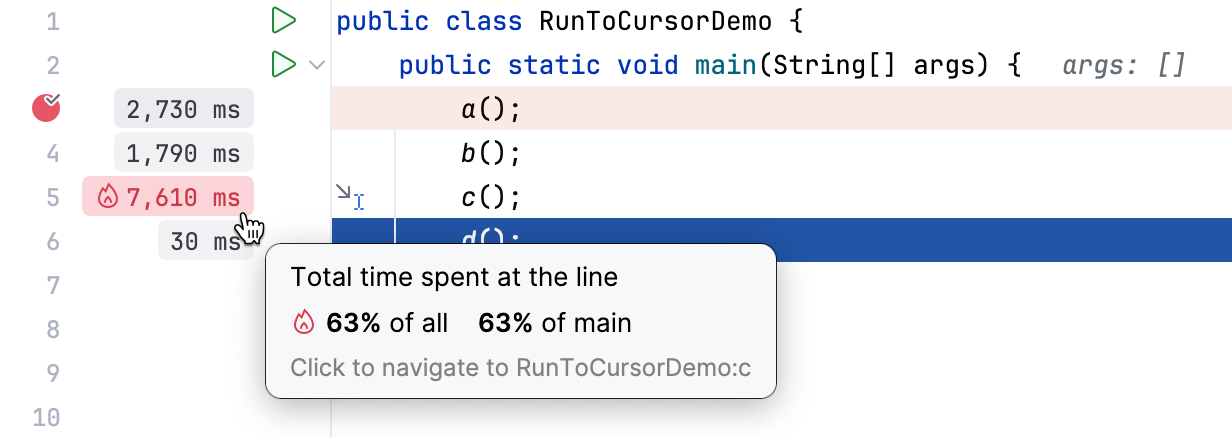
To turn this feature off, right-click a label and select Disable Recording Time with Run to Cursor.
> **Tip:**
> Run to Cursor is a quick way to measure the performance of a code fragment. If you need to analyze the entire program, consider [attaching the profiler](read-the-profiling-report.html#line-profiler).
## Force step into
> **TL;DR**
> Select Force Step Into from the  menu or press `Alt+Shift+F7` (Windows), `⌥ ⇧ F7` (macOS), `⌥ ⇧ F7` (IntelliJ IDEA Classic (macOS)), `⌥ ⇧ ;` (macOS System Shortcuts), `Alt+Shift+F7` (XWin), `Alt+Shift+F7` (GNOME), `Alt+Shift+F7` (KDE), `Alt+Shift+F7` (Emacs), `Alt+Shift+F7` (Sublime Text), `⌥ ⇧ F7` (Sublime Text (macOS)), `Alt+Shift+F7` (NetBeans), `Alt+F11` (Visual Studio), `⌥ F11` (Visual Studio (macOS)), `Alt+Shift+F7` (Eclipse), `⌘ ⌃ F5` (Eclipse (macOS)).
Steps in the method even if this method is [skipped](#configuring-skipped-list) by the regular Step Into.
```JAVA
static void count(int to) {
for (int i = 0; i < to; i++) {
// the program is suspended here
System.out.println(i);
}
System.out.println("Complete!");
}
```
In the example, we jump right into the implementation of the `System.out.println()` method, while the regular Step Into would proceed to the next iteration of the loop.
```JAVA
public void println(String x) {
// Force Step Into enters the implementation of PrintStream.println()
if (getClass() == PrintStream.class) {
writeln(String.valueOf(x));
} else {
synchronized (this) {
print(x);
newLine();
}
}
}
```
## Force run to cursor
[Continues the execution](#run-to-cursor) until the position of the caret is reached. All breakpoints on the way are ignored.
Procedure:
1. Place the caret at the line where you want the program to pause.
2. Select Force Run to Cursor from the  menu or press `Ctrl+Alt+F9` (Windows), `⌘ ⌥ F9` (macOS), `⌘ ⌥ F9` (IntelliJ IDEA Classic (macOS)), `⌃ ⌥ ⇧ \` (macOS System Shortcuts), `Ctrl+Alt+9` (XWin), `Ctrl+Alt+9` (GNOME), `Ctrl+Alt+9` (KDE), `Ctrl+Alt+F9` (Emacs), `Ctrl+Alt+F9` (Sublime Text), `⌘ ⌥ F9` (Sublime Text (macOS)), `Ctrl+Alt+F9` (NetBeans), `Ctrl+Alt+F9` (Visual Studio), `⌘ ⌥ F9` (Visual Studio (macOS)), `Ctrl+Alt+F9` (Eclipse), `⌘ ⌥ F9` (Eclipse (macOS)).
## Force step over
> **TL;DR**
> Select Force Step Over from the  menu or press `Alt+Shift+F8` (Windows), `⌥ ⇧ F8` (macOS), `⌥ ⇧ F8` (IntelliJ IDEA Classic (macOS)), `⌥ ⇧ Quote` (macOS System Shortcuts), `Alt+Shift+F8` (XWin), `Alt+Shift+F8` (GNOME), `Alt+Shift+F8` (KDE), `Alt+Shift+F8` (Emacs), `Alt+Shift+F8` (Sublime Text), `⌥ ⇧ F8` (Sublime Text (macOS)), `Alt+Shift+F8` (NetBeans), `Alt+Shift+F8` (Visual Studio), `⌥ ⇧ F8` (Visual Studio (macOS)), `Alt+Shift+F8` (Eclipse), `⌘ ⌃ F6` (Eclipse (macOS)).
[Steps over](#step-over) the current line of code and takes you to the next line even if the current line has method calls in it. If there are breakpoints in the called methods, they are ignored.
## Reset frame
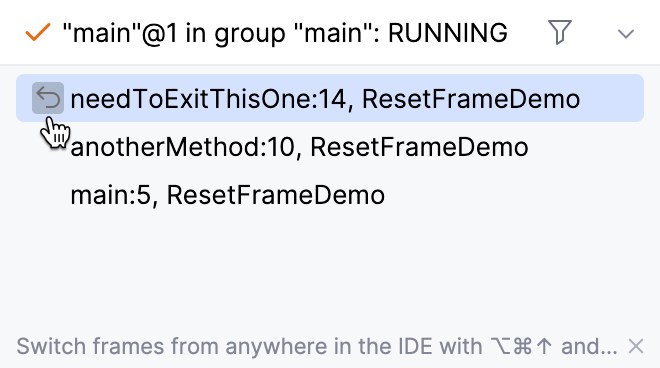
Allows you to undo the last frame and restore the previous frame in the stack. This can be useful, for example, if you've mistakenly stepped too far, or want to re-enter a function where you missed a critical spot.
Note that this option only affects local variables and does not restore the overall program state in that it does not revert values for static and instance variables. This may result in an altered program flow.
Procedure:
* In the Threads tab, hover over the frame you want to reset, then click the Reset Frame button that appears.
```JAVA
public static void main(String[] args) {
count(10);
System.out.println("Count complete!");
}
private static void count(int to) {
for (int i = 0; i < to; i++) {
// the program is suspended here
System.out.println(i);
}
}
```
In the example, dropping the frame returns you to `main()` as if `count` has never been executed. There are no static or instance variables, which were affected, however the console output, which has been already produced and can be considered a side effect, stays.
```JAVA
public static void main(String[] args) {
// Reset Frame returns the execution to the line preceding the last method call
count(10);
System.out.println("Count complete!");
}
private static void count(int to) {
for (int i = 0; i < to; i++) {
System.out.println(i);
}
}
```
> **Note:**
> Reset Frame is not equivalent to going back in time. Keep this in mind when debugging your applications.
## Troubleshoot skipped breakpoints
IntelliJ IDEA may skip breakpoints under the following circumstances:
* The breakpoint was hit in another thread while stepping or performing Run to Cursor
* The breakpoint was hit within a code block evaluated by a feature such as auto-expressions or watches.
If that happens to breakpoints that are critical for your debugging session, do the following to prevent IntelliJ IDEA from missing them:
* Perform stepping or Run to Cursor from a breakpoint that [only pauses the current thread](using-breakpoints.html#suspend_policy)
* Turn off the following features: * [Auto-expressions in Variables view](customizing-views.html#auto-expressions) * [Alternative view for Collections classes](customizing-views.html#data-view-properties) * [toString() object view](customizing-views.html#data-view-properties)
> **Tip:**
> You can configure the debugger notifications on the Appearance & Behavior | Notifications settings page `Ctrl+Alt+S` (Windows), `⌘ Comma` (macOS), `⌘ Comma` (IntelliJ IDEA Classic (macOS)), `⌘ Comma` (macOS System Shortcuts), `Ctrl+Alt+S` (XWin), `Ctrl+Alt+S` (GNOME), `Ctrl+Alt+S` (KDE), `Ctrl+Alt+S` (Emacs), `Ctrl+Alt+S` (Sublime Text), `⌘ Comma` (Sublime Text (macOS)), `Ctrl+Alt+S` (NetBeans), `Ctrl+Alt+S` (Visual Studio), `⌘ Comma` (Visual Studio (macOS)), `Ctrl+Alt+S` (Eclipse), `⌘ Comma` (Eclipse (macOS)) . For more information, refer to [Notifications](notifications.html).
## Improve stepping speed
Debugger features consume resources and may impact stepping performance. If the performance is not satisfactory, follow the recommendations provided in this chapter to optimize it.
Procedure:
* Use the [Overhead](monitor-debugger-overhead.html) feature to identify the cause(s) of performance degradation.
* Disable or minimize the use of the following features if they are not required for your project:
* [Method breakpoints and field watchpoints](using-breakpoints.html)
* The Show Method Return Values option. You can access it under `More | Debugger Settings` on the debugger's toolbar.
* The Alternate view for Collections classes option ( `Settings | Build, Execution, Deployment | Debugger | Data Views | Java` )
* 'toString' object view ( `Settings | Build, Execution, Deployment | Debugger | Data Views | Java` )
* Simplify the conditions for [breakpoints and watchpoints](using-breakpoints.html), especially frequently hit ones.
* During the debugging session, switch to a view with fewer elements.
## Configure stepping behavior
Procedure:
* Press `Ctrl+Alt+S` (Windows), `⌘ Comma` (macOS), `⌘ Comma` (IntelliJ IDEA Classic (macOS)), `⌘ Comma` (macOS System Shortcuts), `Ctrl+Alt+S` (XWin), `Ctrl+Alt+S` (GNOME), `Ctrl+Alt+S` (KDE), `Ctrl+Alt+S` (Emacs), `Ctrl+Alt+S` (Sublime Text), `⌘ Comma` (Sublime Text (macOS)), `Ctrl+Alt+S` (NetBeans), `Ctrl+Alt+S` (Visual Studio), `⌘ Comma` (Visual Studio (macOS)), `Ctrl+Alt+S` (Eclipse), `⌘ Comma` (Eclipse (macOS)) to open settings and then select `Build, Execution, Deployment | Debugger | Stepping`.
| Option | Description |
| --- | --- |
| Skip synthetic methods | Select this checkbox to suppress stepping into synthetic methods (methods generated by the compiler) while debugging. |
| Skip constructors | Select this checkbox to suppress stepping into constructors while debugging. |
| Skip class loaders | Select this checkbox to suppress stepping into class loaders while debugging. |
| Skip simple getters | Select this checkbox to suppress stepping into simple getter methods (that is, methods designed just to return the necessary value) while debugging. |
| Do not step into the classes | Select this checkbox to suppress stepping into the specified classes while debugging. The list of classes contains entries of two types: * Fully qualified class names. * Regular expressions (either exact matches or patterns that begin or end with "*", for example, `java.*`). By default, the list contains some standard Java SDK class patterns so that you do not have to waste your time stepping into Java class libraries. Use the checkboxes in the list to disable/enable particular patterns temporarily. Use the ,, and  buttons to manage the list. |
| Evaluate finally blocks on pop frame | Select whether you want to evaluate `finally` blocks on pop frame or not, or you want to be notified before they are evaluated. |
| Resume only the current thread | Select this checkbox, if you need to resume only the active thread when stepping. |