# Using profiler labels
> **Note:**
> The Go Optimization tool window requires the bundled Diagrams plugin. If the tool window is not available, open settings by pressing `Ctrl+Alt+S` (Windows), `⌘ Comma` (macOS), `⌘ Comma` (IntelliJ IDEA Classic (macOS)), `⌘ Comma` (macOS System Shortcuts), `Ctrl+Alt+S` (XWin), `Ctrl+Alt+S` (GNOME), `Ctrl+Alt+S` (KDE), `Ctrl+Alt+S` (Emacs), `Ctrl+Alt+S` (Sublime Text), `⌘ Comma` (Sublime Text (macOS)), `Ctrl+Alt+S` (NetBeans), `Ctrl+Alt+S` (Visual Studio), `⌘ Comma` (Visual Studio (macOS)), `Ctrl+Alt+S` (Eclipse), `⌘ Comma` (Eclipse (macOS)) and navigate to `Plugins | Installed`. Enable the Diagrams plugin and restart the IDE if prompted.
Goroutines are functions or methods that run concurrently with other functions or methods. To create a goroutine, use the `go` keyword followed by a function invocation (for example, `go func(p string, rid int64)`). But using lots of goroutines makes a program harder to debug. To differentiate between goroutines, you can label goroutines with custom data.
Since Go 1.9, you can record additional information to provide more context about the execution path. You can record any set of labels as a part of the profiling data and use these labels later to examine the profiler output.
For example, you have a queue handler that processes events created somewhere. The handler can set labels to identify where these events were created.
During debugging and core dump analysis, the context information might be helpful. For example, you can use this information to find a particular goroutine more easily.
## Adding labels
The `runtime/pprof` package has several new functions that you can use to add labels. The most popular is the `Do` function. The `Do` function takes context, adds labels to this context, and passes new context to the f function.
```GO
func Do(ctx context.Context, labels LabelSet, f func(context.Context))
```
The `Do` function writes labels only for the current goroutine. If you create new goroutines in the f function, you can pass the context as an argument.
```GO
func main() {
ctx := context.Background()
for i := 0; i < 10; i++ {
labels := pprof.Labels("path", "/api/profile", "userId", strconv.Itoa(rand.Intn(100)))
go pprof.Do(ctx, labels, f)
}
time.Sleep(time.Second)
}
```
## Viewing labels in IntelliJ IDEA
For illustrative purposes, copy the following [code example from GitHub](https://github.com/apronichev/documentation-code-examples/blob/master/debuggerProfilerLabels/main.go).
Put a breakpoint where the `println("ok")` is called. To put the breakpoint, click the gutter at line 21. Run the debug for the `main` function. To start debugging, click the Run icon () in the gutter near the `main` function and select Debug . From the Goroutines list, observe available goroutines.
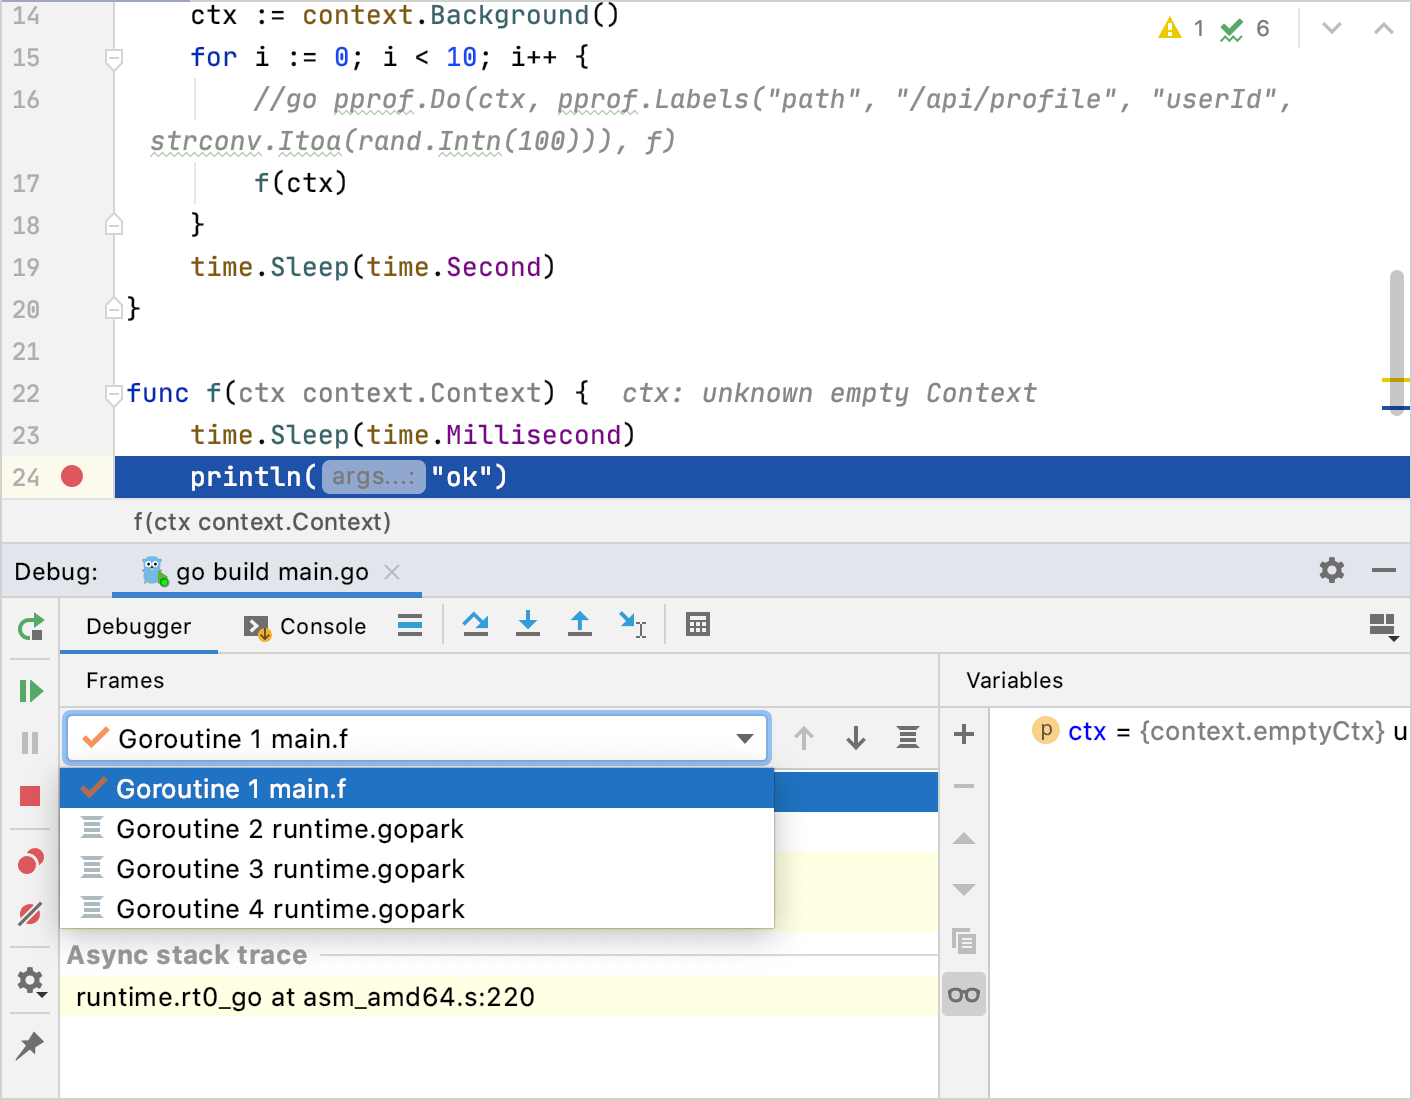
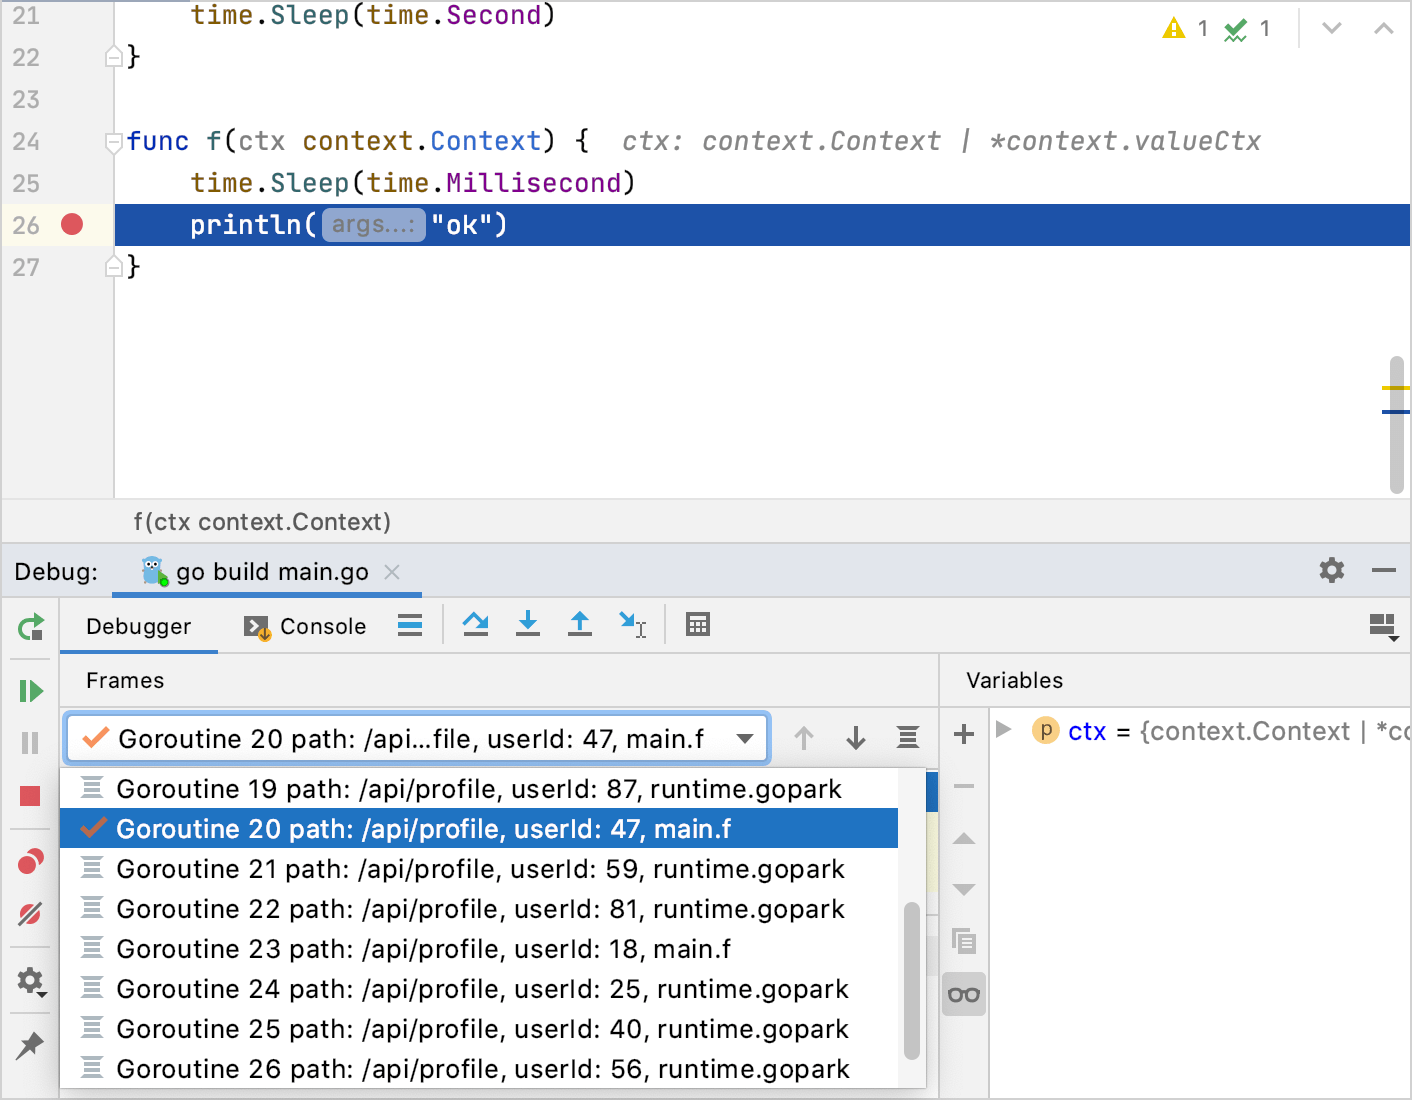
Press `Ctrl+F2` (Windows), `⌘ F2` (macOS), `⌘ F2` (IntelliJ IDEA Classic (macOS)), `⌃ ⇧ .` (macOS System Shortcuts), `Ctrl+F2` (XWin), `Ctrl+F2` (GNOME), `Ctrl+2` (KDE), `Ctrl+F2` (Emacs), `Ctrl+F2` (Sublime Text), `Ctrl+F2` (Sublime Text (macOS)), `Shift+F5` (NetBeans), `Shift+F5` (Visual Studio), `⇧ F5` (Visual Studio (macOS)), `Ctrl+F2` (Eclipse), `⌘ F2` (Eclipse (macOS)) to stop debugging. Delete the `f(ctx)` call and uncomment the `Do` function. Rerun the debugging process by pressing `⌃ ⇧ D` (Windows), `⌃ ⇧ D` (macOS), `⌃ ⇧ F9` (IntelliJ IDEA Classic (macOS)), `⌃ ⇧ D` (macOS System Shortcuts), `⌃ ⇧ D` (XWin), `⌃ ⇧ D` (GNOME), `⌃ ⇧ D` (KDE), `⌃ ⇧ D` (Emacs), `⌃ ⇧ D` (Sublime Text), `⌃ ⇧ D` (Sublime Text (macOS)), `Ctrl+Shift+F5` (NetBeans), `⌃ ⇧ D` (Visual Studio), `⌃ ⇧ D` (Visual Studio (macOS)), `⌃ ⇧ D` (Eclipse), `⌃ ⇧ D` (Eclipse (macOS)). Explore the Goroutines list. Goroutine names include the following information: `/api/profile, userId: `. You can use this information to find a particular goroutine during debugging or core dump analysis.
## Useful links
* [How to Find Goroutines During Debugging](https://blog.jetbrains.com/go/2020/03/03/how-to-find-goroutines-during-debugging/): read the tutorial on how to use profiler tags in IntelliJ IDEA.
* [Profiler labels in Go at rakyll.org](https://rakyll.org/profiler-labels/): read more about profiler labels.