Examining Suspended Program
When a breakpoint is hit, or a program execution is manually suspended, you can examine your application by analyzing frames.
Aframe corresponds to an active method or function call. A frame stores the local variables of the called method or function, the arguments to it, and the code context that enables expression evaluation.
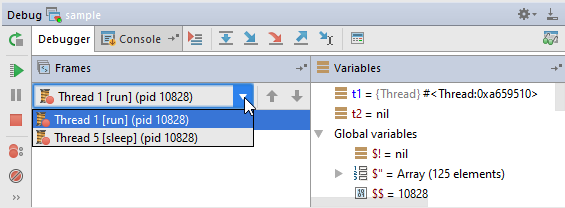
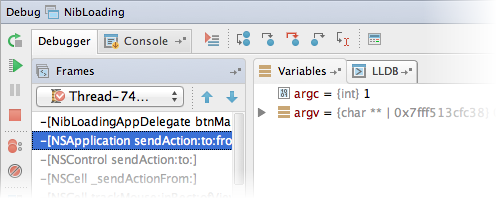
All currently active frames are displayed on the Frames pane of the Debug tool window, where you can switch between them and analyze the information stored therein.
To examine frames of a suspended thread
Select a thread from the thread selector drop-down list on top of the Frames pane. The list of frames is displayed:

Select a frame from the Frames list. The Variables pane shows all the variables available to the method call in this frame, so you can further explore them.

Navigating between frames
Use up and down arrow buttons on the toolbar.
Use ↑ and ↓ shortcuts.
You do not need to perform any actions to navigate to the frame's source code. AppCode automatically jumps to the source code of the selected frame in the editor.
To navigate between frames, do one of the following:
Use up and down arrow buttons on the toolbar.
Use ↑ and ↓ shortcuts.