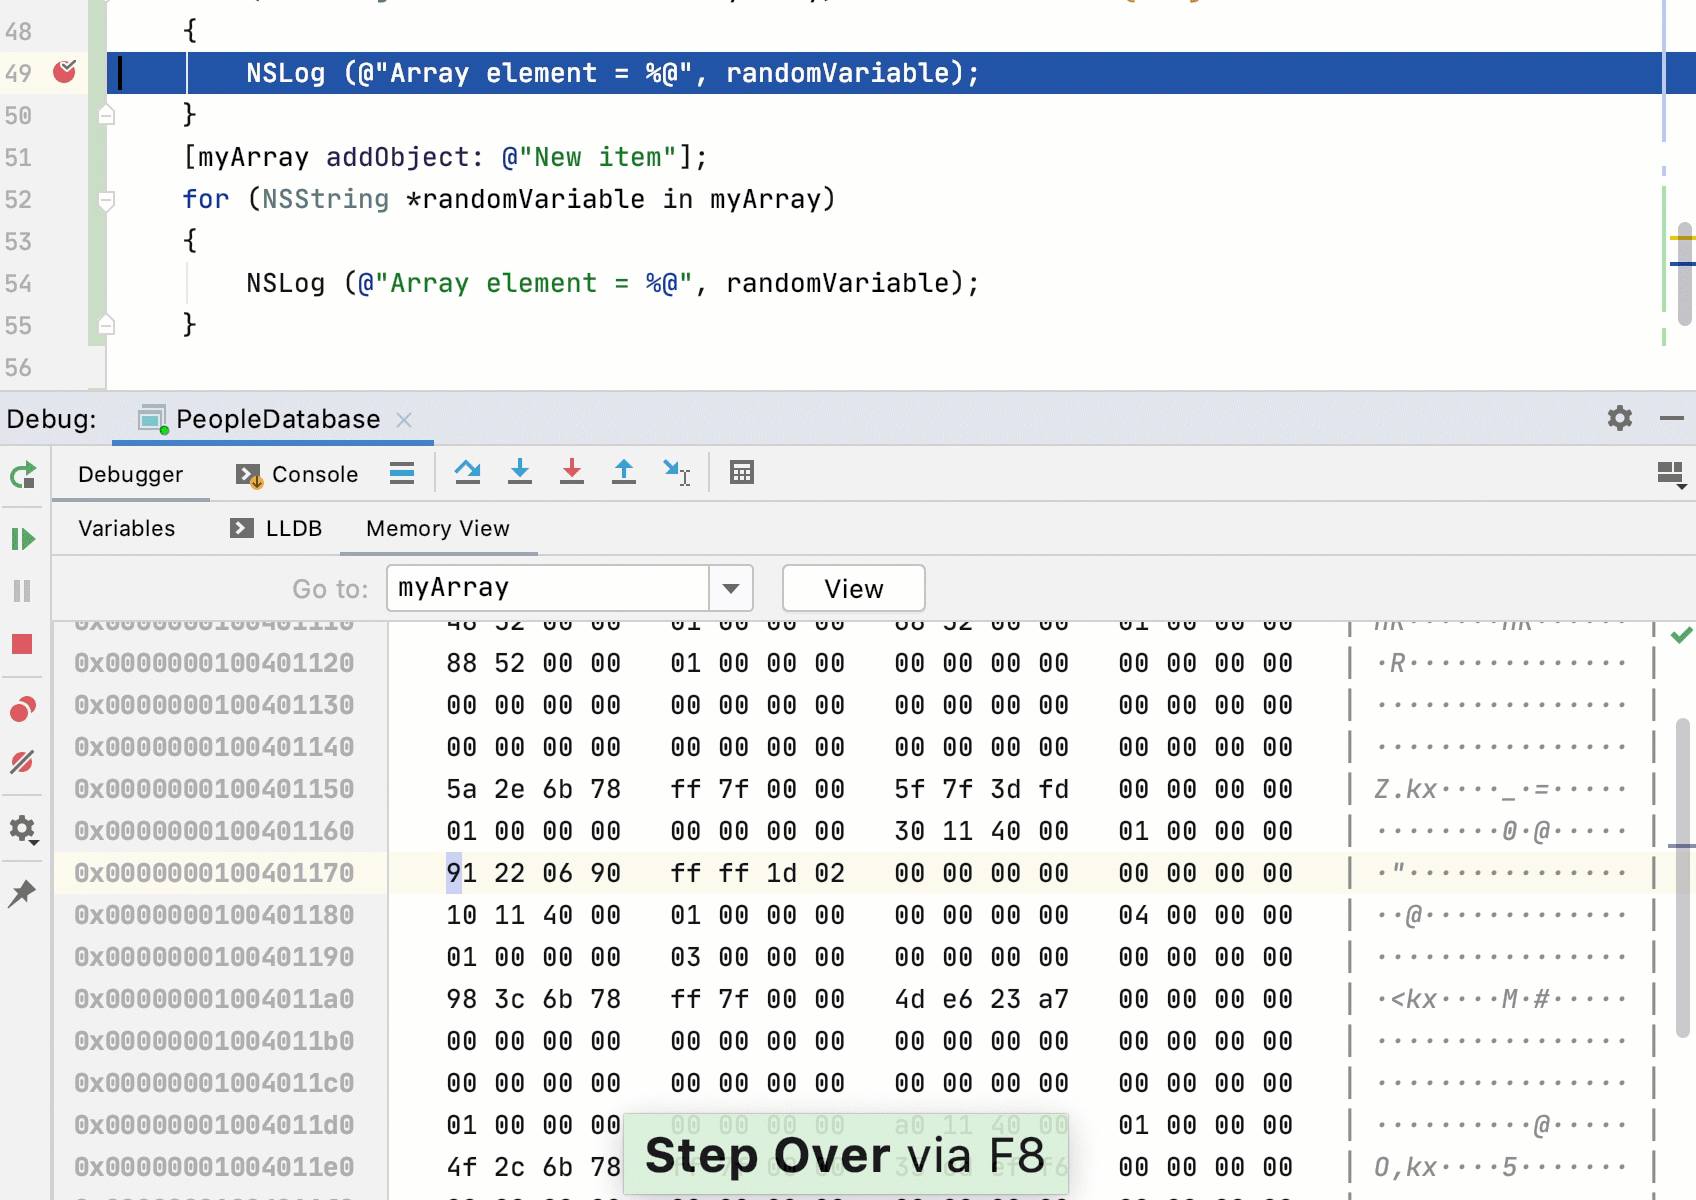
Examine raw memory
In AppCode, you can view raw memory of running processes using the Memory View tab of the Debug tool window. You can jump from a variable in the Variables tab to the memory region that includes the required address and examine the changes while stepping through the program.
Show Memory View
In the Variables tab of the Debugger tool window, select the desired variable.
Press ⌃⏎ or choose Show in Memory View from the variable's context menu:

The Memory View window initially shows a 256-byte region that starts from the chosen address, with higher memory addresses at the bottom of the window. When you then invoke Memory View for other variables, they are highlighted in the same window, and the region is extended to show more addresses if necessary.
Use the context menu of the left column to hide/show or copy the addresses:

The right-hand column displays the ASCII character equivalents of the memory values.
When you step through the code, AppCode highlights the changes that happen in the currently shown memory region:
Open Memory View in the editor
Use the Move Memory View to Editor
 button on the Variables (or Watches) tab to open Memory View in the editor:
This way, you can open two independent memory windows, in the Debug tool window and in the editor:

Go to address
Use the Go to field of the Memory View window to jump to a particular address. You can enter the address directly as a hex number, specify a pointer variable or an expression evaluating to a pointer, or use the address of operator
&to get the address of any variable.Code completion in this field helps in choosing from the known symbols:
