Multiuser debugging via Xdebug proxies
When you start a debugging session, the Xdebug extension connects to the IP address PhpStorm is running at, specified as the xdebug.remote_host (for Xdebug 2) or xdebug.client_host (for Xdebug 3) value. PhpStorm accepts this connection and can communicate with Xdebug over it. Xdebug only supports connecting to a single IP address, and does not automatically connect back to the IP address that runs the browser because of security reasons. To debug PHP applications in multiuser environments, Xdebug offers a so-called DBGp proxy.
When a proxy is used, the PHP Xdebug extension no longer connects to PhpStorm directly, but instead connects to the DBGp proxy server. All developers in the team, in turn, then connect to that proxy. Each developer has a separate debugging session running over this proxy, which makes it possible to do multi-user debugging of the same code on the same server.
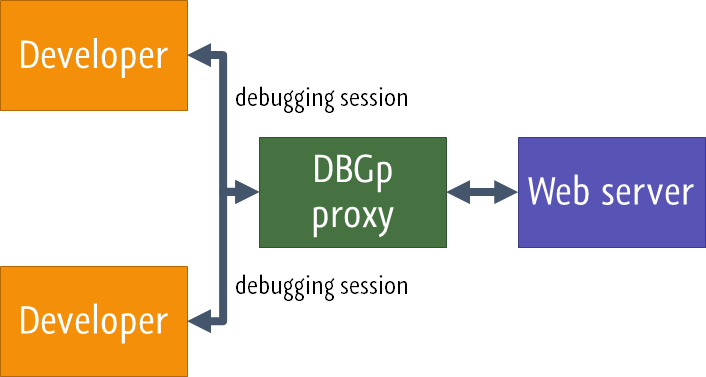
Configure multiuser debugging via an Xdebug proxy (DBGp) server
Download and install a DBGp proxy
To be able to start a debugging session, you'll need to have a DBGp proxy running on a server that can be reached by the web server itself as well as all developer machines. We can install the proxy on the web server, on a machine in the same network, or a machine accessible via an SSH tunnel.
Download the dbgpProxy executable file for your platform on the DBGp Proxy Tool downloads page.
Start the DBGp proxy either on the web server or on a machine that can communicate both with the web server and all developer machines. The DBGp proxy executable accepts two main arguments:
-i: the host and the port to listen on for IDE (client) connections-s: the host and the port to listen on for debugger engine (server) connections
For more information, refer to DBGp Proxy Tool documentation.
In the following example, we start a proxy that listens for debugger connections on the loopback address 127.0.0.1 and port 9001, and listens for developers on the machine IP address and port 9000.
dbgpProxy.exe -i 192.168.1.11:9000 -s 127.0.0.1:9001./dbgpProxy-macos -i 192.168.1.11:9000 -s 127.0.0.1:9001./dbgpProxy -i 192.168.1.11:9000 -s 127.0.0.1:9001The DBGp proxy will confirm these settings when started:

Make sure Xdebug is installed and configured on the web server
Open the active php.ini file in the editor:
In the Settings dialog (Ctrl+Alt+S) , click PHP.
On the PHP page that opens, click
next to the CLI Interpreter field.
In the CLI Interpreters dialog that opens, the Configuration file read-only field shows the path to the active php.ini file. Click Open in Editor.
Make sure that at least the following settings are specified:
[xdebug] zend_extension="<path to xdebug extension>" xdebug.mode=debug xdebug.client_host=127.0.0.1 xdebug.client_port="<the port (9003 by default) to which Xdebug connects>"[xdebug] zend_extension="<path to xdebug extension>" xdebug.remote_enable=1 xdebug.remote_host=dbgp_proxy_hostname_or_ip xdebug.remote_port="<the port (9000 by default) to which Xdebug connects>"
For more information about configuring Xdebug, refer to Configure Xdebug.
Configure access to the DBGp proxy server from PhpStorm
From the main menu, select .
In the DBGP Proxy dialog that opens, specify the IDE key value (this should be a unique value for each developer, as it identifies the debugging session), the host and port of the Xdebug proxy server.
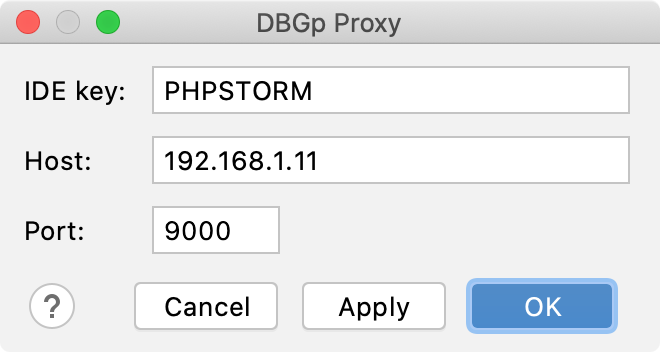
Click OK to connect to the specified proxy server. The server registers the credentials, and confirms the connection.

PhpStorm will notify about the successful connection, too.
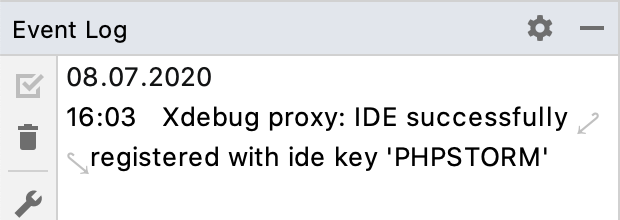
To update the existing credentials, select in the main menu. In the DBGp Proxy dialog that opens, edit the IDE key, the host, and the port settings.
To discard the current credentials, select in the main menu.
Start a debugging session in the browser
Make sure that the browser debugging extension that you are using is set to the registered IDE key:
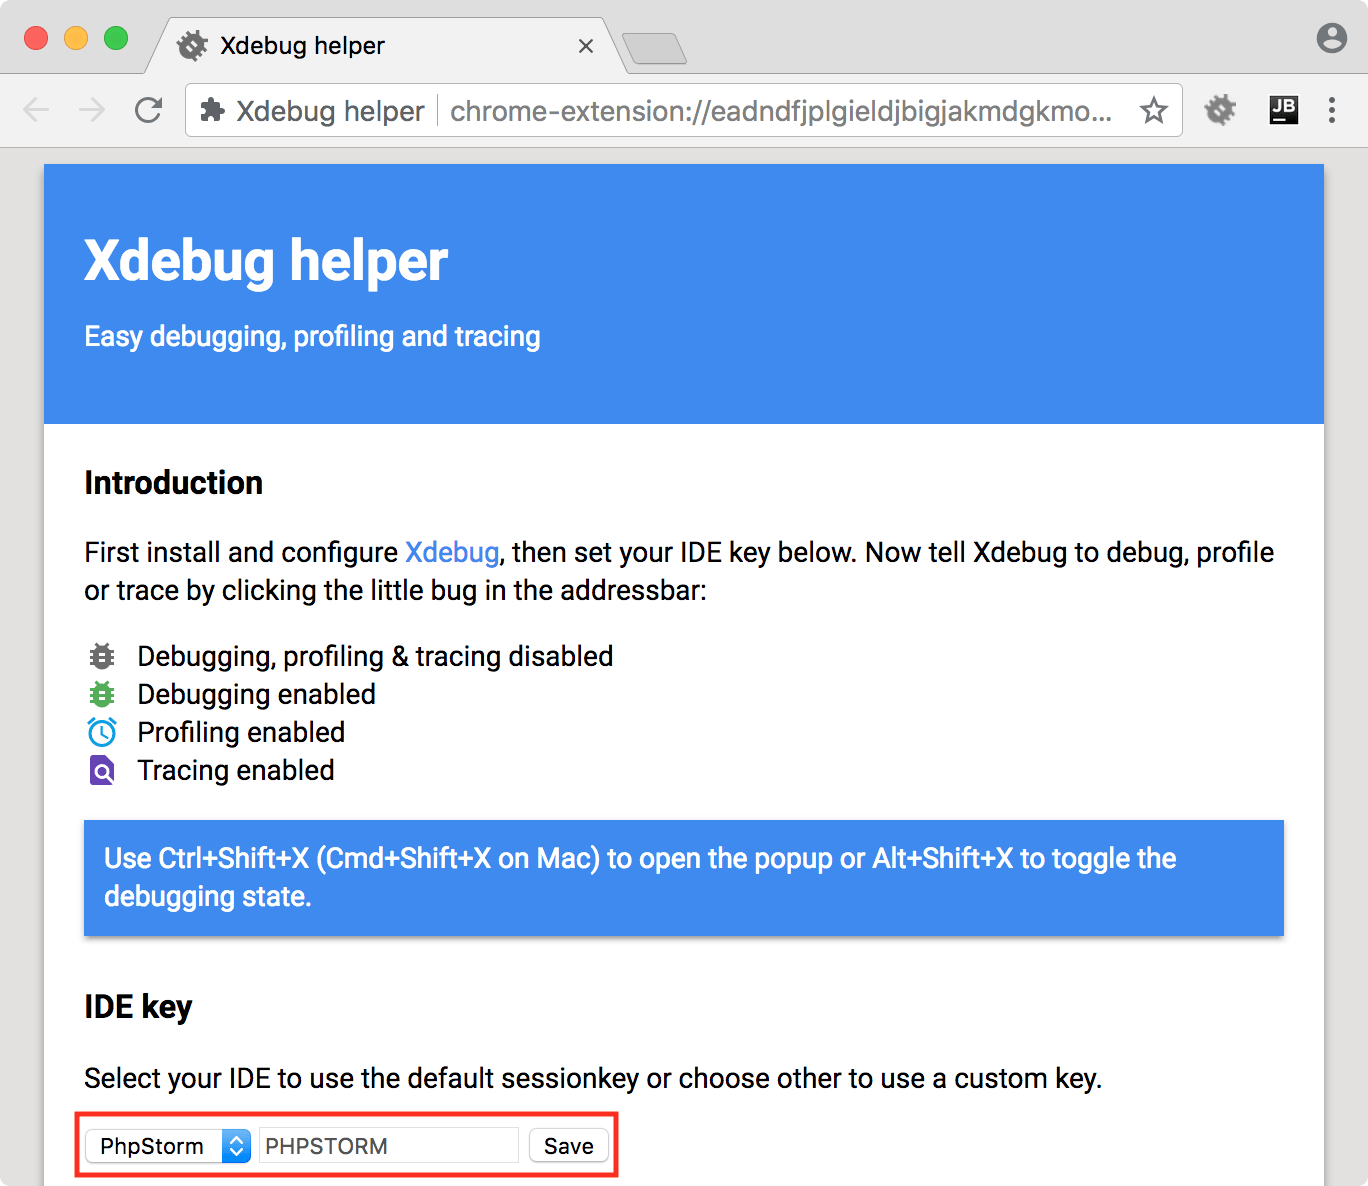
In PhpStorm, enable listening to incoming debug connections by either clicking
(
in the classic UI) on the toolbar/the status bar or selecting in the main menu. This will ensure PhpStorm reacts when a debugging session is started and opens the Debug tool window automatically. Before launching the script, make sure that either a breakpoint is set or the Break at first line in PHP scripts option is enabled on the Debug page of the Settings dialog Ctrl+Alt+S.
Start the debugging session by refreshing the page in the browser.
Troubleshooting
Remote file path is not mapped to any file path in project
In some cases, the debugger can connect, but we get the error messages indicating that no mapping between the remote and project files is defined. This means that PhpStorm cannot determine which local file corresponds to the file being debugged.

We can solve this problem by clicking Click to set up path mappings and providing the necessary path mappings. Additionally, we can configure these mappings using the techniques outlined in Configure synchronization with a server.
No connection could be made because the target machine actively refused it
Make sure that PhpStorm has been registered with the DBGp proxy, and it is listening for incoming debugger connections.
Make sure that the correct IDE key is set in PhpStorm and in the debugger bookmarklet or browser extension.
Is there a firewall blocking connections to the DBGp proxy? If so, make sure the PHP Xdebug extension can connect to it, as well as the developer machines. You can use http://canyouseeme.org or a similar service to check for opened inbound ports.
Is there a firewall blocking connections to the IDE? Make sure that PhpStorm can be connected to from the DBGp proxy machine. You can use http://canyouseeme.org or a similar service to check for opened inbound ports.
The DBGp proxy application binds to the wrong IP address. Run it using 0.0.0.0 as the address, so it binds to any IP address on the DBGp proxy server. For example, run
dbgpproxy -i 0.0.0.0:9001 -s 0.0.0.0:9000.
When testing multi-user debugging in PhpStorm with Xdebug and DBGp proxy installed on the same machine, there are some additional things to verify:
PhpStorm binds to the wrong IP address. When a DBGp proxy runs on a local machine where PhpStorm is also being run, the IDE may be using the wrong network subnet. To fix this, select in the main menu and set DBGp proxy server IP address to 0.0.0.0. Then, try re-registering PhpStorm with the DBGp proxy.
A port conflict exists. When testing DBGp on a local machine, both PhpStorm and DBGp may want to bind to the same port. Make sure this is not the case by either configuring DBGp to use a different port or changing the PhpStorm's Xdebug port on the page of the Settings dialog Ctrl+Alt+S.