Running and Debugging Node.js
PhpStorm helps you run and debug your Node.js applications. You can debug applications that are started from PhpStorm as well as attach to already running applications.
Running a Node.js application
PhpStorm runs Node.js applications according to a run configuration of the type Node.js. PhpStorm also uses this configuration for debugging Node.js applications locally.
To create a Node.js run/debug configuration
- On the main menu, choose , then in the Edit Configurations dialog, click
 on the toolbar and select Node.js from the pop-up list. The Run/Debug Configuration: Node.js dialog opens.
 - Choose Node.js interpreter to use from the drop-down list or configure a new one as described in Configuring Node.js Interpreters.
- In the JavaScript File field, specify the path to the main file of the application that starts it (for example,
bin/wwwfor Node.js Express applications).
Optionally
- In the Node Parameters field, specify the flags that customize the start of Node.js. For example, to make your application accessible for remote debugging, type one of the debugging flags depending on your Node.js version:
--inspect=<debugger port>for Node.js versions 6.5 and higher or--debug=<debugger port>for any Node.js version earlier than 8. The default debugger port is5858. - In the Application parameters text box, specify the arguments to be passed to the application on start through the process.argv array.
To run an application
Choose the newly created Node.js configuration in the Select run/debug configuration drop-down list on the toolbar and click ![]() next to it. The application starts, and the Run Tool Window opens showing the application output.
next to it. The application starts, and the Run Tool Window opens showing the application output.
Debugging a Node.js application
PhpStorm makes it easier to debug Node.js applications. You can put breakpoints right in your JavaScript or TypeScript code so you no longer need any debugger and console.log() statements. You can do many things that will help you explore the code and understand where the bug is. In the Debug tool window, you can view the call stack and the variables in their current state, evaluate expressions in the editor, and step through the code.
Local and Remote debugging
PhpStorm supports two debugging modes:
- Local debugging: in this mode, your application is started from PhpStorm and is running locally on your computer. To debug it, use a Node.js configuration.
- Debugging a remote application: in this mode, your application is running in a remote environment in the debug mode and PhpStorm attaches to a running process. PhpStorm recognizes
--inspectand--debugflags so you can make any application accessible for remote debugging. PhpStorm supports remote debugging with the Chrome Debugging Protocol and the V8 Debugging Protocol (also known as Legacy Protocol). In either case, a debugging session is initiated through a run/debug configuration of the type Attach to Node.js/Chrome.
Debugging a Node.js application locally
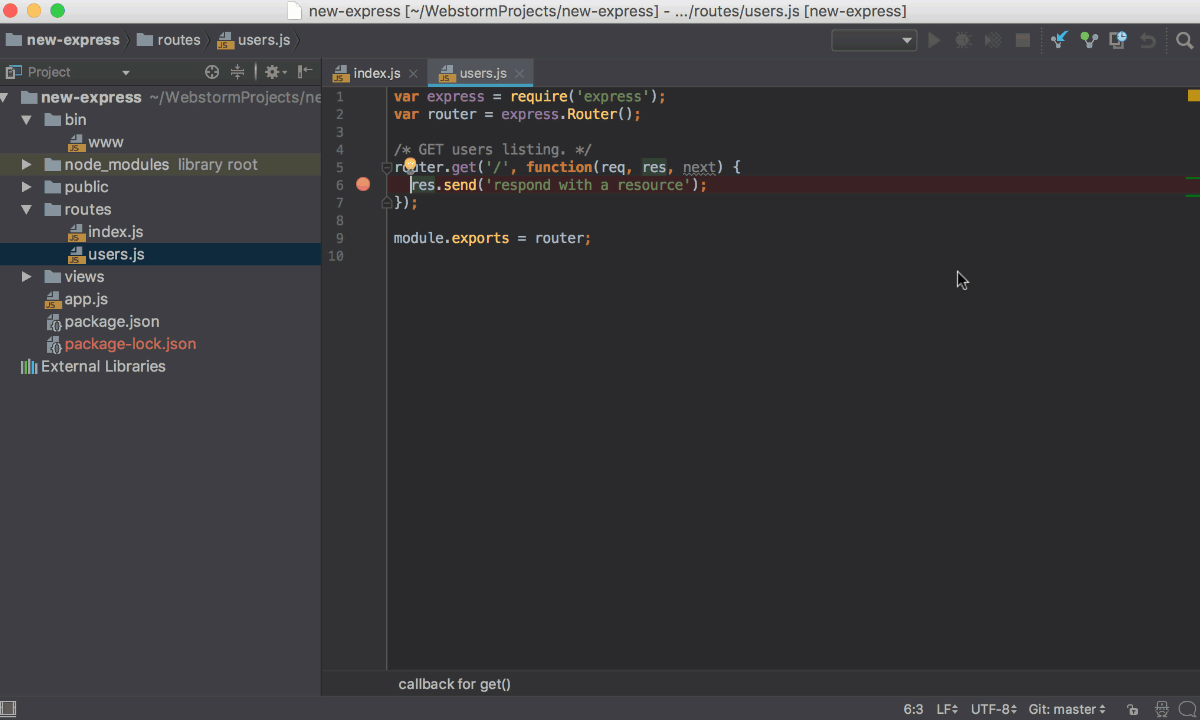
- Set the breakpoints in the Node.js code where necessary.
- Create a Node.js run/debug configuration as described above. If necessary, PhpStorm can generate a JavaScript Debug configuration and start it automatically together with the Node.js configuration as described in Starting a JavaScript Debug configuration together with a Node.js configuration.
- Choose the newly created Node.js configuration in the Select run/debug configuration drop-down list on the toolbar and click
 next to it. The Debug Tool Window opens.
 - Perform the steps that will trigger the execution of the code with the breakpoints.
- Switch to PhpStorm, where the controls of the Debug tool window are now enabled. Proceed with the debugging session — step through the breakpoints, switch between frames, change values on-the-fly, examine a suspended program, evaluate expressions, and set watches.
Debugging a running Node.js application
With PhpStorm, you can debug an application that is running in a remote environment. PhpStorm supports remote debugging with the Chrome Debugging Protocol and the V8 Debugging Protocol (also known as Legacy Protocol). In either case, a debugging session is initiated through an Attach to Node.js/Chrome configuration.
Remote debugging with Chrome debugging protocol
Use this protocol to debug applications started with the --inspect flag. This flag is used with Node.js versions later than 6.3.
To create an Attach to Node.js/Chrome run/debug configuration
- Choose on the main menu, then click in the Edit Configuration dialog box that opens, and choose Attach to Node.js/Chrome from the list. The Run/Debug Configuration: Attach to Node.js/Chrome dialog box opens.
- Specify the host where the target application is running and the port passed to
--inspectwhen starting the Node.js process to connect to. Copy the port number from the information messageDebugger listening <host>:<port>in the Terminal tool window or in the Run tool window that controls the running application. The default port is 9229. - In the Attach to area, choose Chrome or Node.js > 6.3 started with --inspect.
To start debugging
- Set the breakpoints in the Node.js code as necessary.
- Choose the newly created Attach to Node.js/Chrome configuration in the Select run/debug configuration drop-down list on the toolbar and click next to it. The Debug Tool Window opens.
- Perform the actions that will trigger the code at the breakpoint. Control over the debugging session returns to PhpStorm.
- Switch to PhpStorm. In the Debug tool window, step through the breakpoints, switch between frames, change values on-the-fly, examine a suspended program, evaluate expressions, and set watches.
Remote debugging with V8 Debugging Protocol
Use this protocol to debug applications started with the --debug flag. This flag is used with Node.js versions earlier than 8.
To create an Attach to Node.js/Chrome run/debug configuration
- Choose on the main menu, then click in the Edit Configuration dialog box that opens, and choose Attach to Node.js/Chrome from the list. The Run/Debug Configuration: Attach to Node.js/Chrome dialog box opens.
- Specify the host where the target application is running and the port passed to
--debugwhen starting the Node.js process to connect to. Copy the port number from the information messageDebugger listening <host>:<port>in the Terminal tool window or in the Run tool window that controls the running application. The default port is 9229. - In the Attach to area, choose Node.js < 8 started with --debug.
To start debugging
- Make sure the application to debug has been launched in the remote environment with the following parameters:
--debug=<debugger port>The default port is5858. - Set the breakpoints in the Node.js code as necessary.
- Choose the newly created Attach to Node.js/Chrome configuration in the Select run/debug configuration drop-down list on the toolbar and click next to it. The Debug Tool Window opens.
- Perform the actions that will trigger the code at the breakpoint. Control over the debugging session returns to PhpStorm.
- Switch to PhpStorm, where the controls of the Debug tool window are now enabled. Proceed with the debugging session — step through the breakpoints, switch between frames, change values on-the-fly, examine a suspended program, evaluate expressions, and set watches.
Starting a JavaScript Debug configuration together with a Node.js configuration
With PhpStorm, you can debug the server-side code and the client-side JavaScript code of your application in two modes:
- Separately, using single-run configurations.
- Simultaneously, using a complex Node.js with JavaScript Debug configuration. All you need is configure the behaviour of the browser and enable debugging the client-side code of the application. This functionality is provided through a
JavaScript Debugrun configuration, so technically, PhpStorm creates separate run configurations for the server-side and the client-side code, but you specify all your settings in one dedicated Node.js run configuration.
To create a complex Node.js with JavaScript Debug configuration
- Choose on the main menu.
- From the list, choose the Node.js run configuration to start together with a JavaScript Debug configuration. In the dialog box that opens, switch to the Browser / Live Edit tab.
- Select the After launch checkbox to start a browser automatically when you launch a debugging session.
- In the text box below, type the URL address to open the application at.
- Choose the browser to use from the drop-down list next to the After launch checkbox.
- To use the system default browser, choose Default.
- To use a custom browser, choose it from the list. Note that Live Edit is fully supported only in Chrome.
- To configure browsers, click the Browse button
 and adjust the settings in the Web Browsers dialog box that opens. For more information, see Configuring Browsers.
- Select the With JavaScript debugger checkbox.
To enable Live Edit in a Node.js application
- Make sure the LiveEdit repository plugin is installed and enabled. The plugin is not bundled with PhpStorm, but it can be installed from the JetBrains plugin repository as described in Installing, Updating and Uninstalling Repository Plugins and Enabling and Disabling Plugins.
- In the Settings/Preferences dialog (Ctrl+Alt+S), click Debugger under Build, Execution, Deployment, and then click Live Edit. The Live Edit page opens.
- Select the Update Node.js application on changes checkbox. Set the elapsed time for applying the changes to a running application: accept the default value
300 msor specify a custom value using the spin box next to the corresponding field.
Debugging a Node.js application running in a remote environment
With PhpStorm, you can attach to Node.js applications that are running in Vagrant boxes, in Docker containers, or on remote hosts accessible via various transfer protocols or via SSH.
Debugging a Node.js application in a Docker container
PhpStorm supports debugging of Node.js applications in Docker containers through run/debug configurations of the type Node.js.
Before you start debugging a Node.js application on Docker
- Make sure Docker is installed, configured, and running as described in Downloading, installing, and starting Docker and Configuring Docker in PhpStorm.
To choose the Node.js interpreter on Docker
- Create a Node.js run/debug configuration as described above.
- Select one of the configured Node.js interpreters of the type Remote Interpreter - Docker from the drop-down list or configure a new one as described in Configuring Node.js Interpreters.
To specify the Docker container settings
Click ![]() next to the Edit Docker Container Settings field and specify the settings in the Edit Docker Container Settings dialog that opens.
next to the Edit Docker Container Settings field and specify the settings in the Edit Docker Container Settings dialog that opens.
Alternatively, select the Auto configure checkbox to do it automatically. Learn more about the Auto configure mode at Quick Tour of WebStorm and Docker: What Happens On Each Run.
To configure port bindings
- Click next to the Docker Container Settings field.
- In the Edit Docker Container Settings dialog that opens, expand the Port bindings area.
- Click and in the Port bindings dialog that opens, map the ports as follows:
- In the Container port text box, type the port specified in your application.
- In the Host port text box, type the port through which you want to open the application in the browser from your computer.
- In the Host IP text box, type the IP address of the Docker's host, the default IP is 192.168.99.100. The host is specified in the API URL field on the Docker page of the Settings / Preferences Dialog.
- Click OK to return to the Edit Docker Container Settings dialog where the new port mapping is added to the list.
- Click OK to return to the Run/Debug Configuration: Node.js dialog.
To start debugging
- Set the breakpoints in the Node.js code as necessary.
- Choose the newly created Node.js configuration in the Select run/debug configuration drop-down list on the toolbar and click next to it.
- Proceed as during a local debugging session, as described above.
Node.js multiprocess debugging
PhpStorm supports debugging additional Node.js processes that are launched by the child_process.fork() method or by the cluster module. Such processes are shown as threads in the Frame pane on the Debugger tab of the Debug Tool Window.
- Set the breakpoints in the processes to debug.
- Create a Node.js run/debug configuration.
- Choose the newly created configuration in the Select run/debug configuration drop-down list on the tool bar and click the Debug toolbar button .
The Debug Tool Window opens and the Frames drop-down list shows the additional processes as threads as soon as they are launched:

To examine the data (variables, watches, etc.) for a process, select its thread in the list and view its data in the Variables and Watches panes. When you select another process, the contents of the panes are updated accordingly.