Browser Debugging Extensions
In order to start debugging, you first need to activate the debugger engine on the server. To do this, you need to set a special GET/POST or COOKIE parameter (see the Xdebug and Zend Debugger official documentation for details). While you can do it manually, it is more convenient to use a browser extension, which lets you enable the debugger with a single click.
The following table lists the available debugging extensions.
Chrome | Firefox | Internet Explorer | Safari | Opera | |
|---|---|---|---|---|---|
Xdebug | |||||
Zend Debugger | If you use Zend Server (version 7 or higher), you can use Z-Ray for debugging. Otherwise, use the PhpStorm bookmarklets generator. | ||||
To configure Xdebug Helper for Chrome
Install the Xdebug helper extension for Chrome from the Chrome Web Store.
In PhpStorm, enable listening to incoming debug connections by either clicking
 on the toolbar or selecting
 -
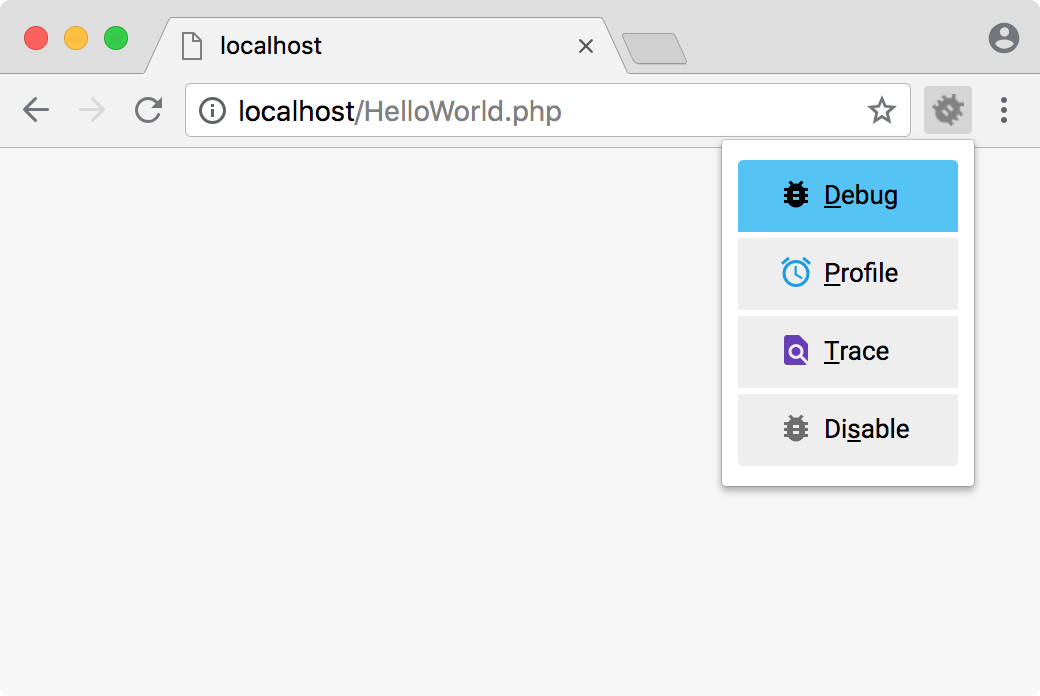
Initiate connection from the browser side. Click the Xdebug Helper icon on the browser toolbar to initiate a debugging, profiling or tracing session:

-
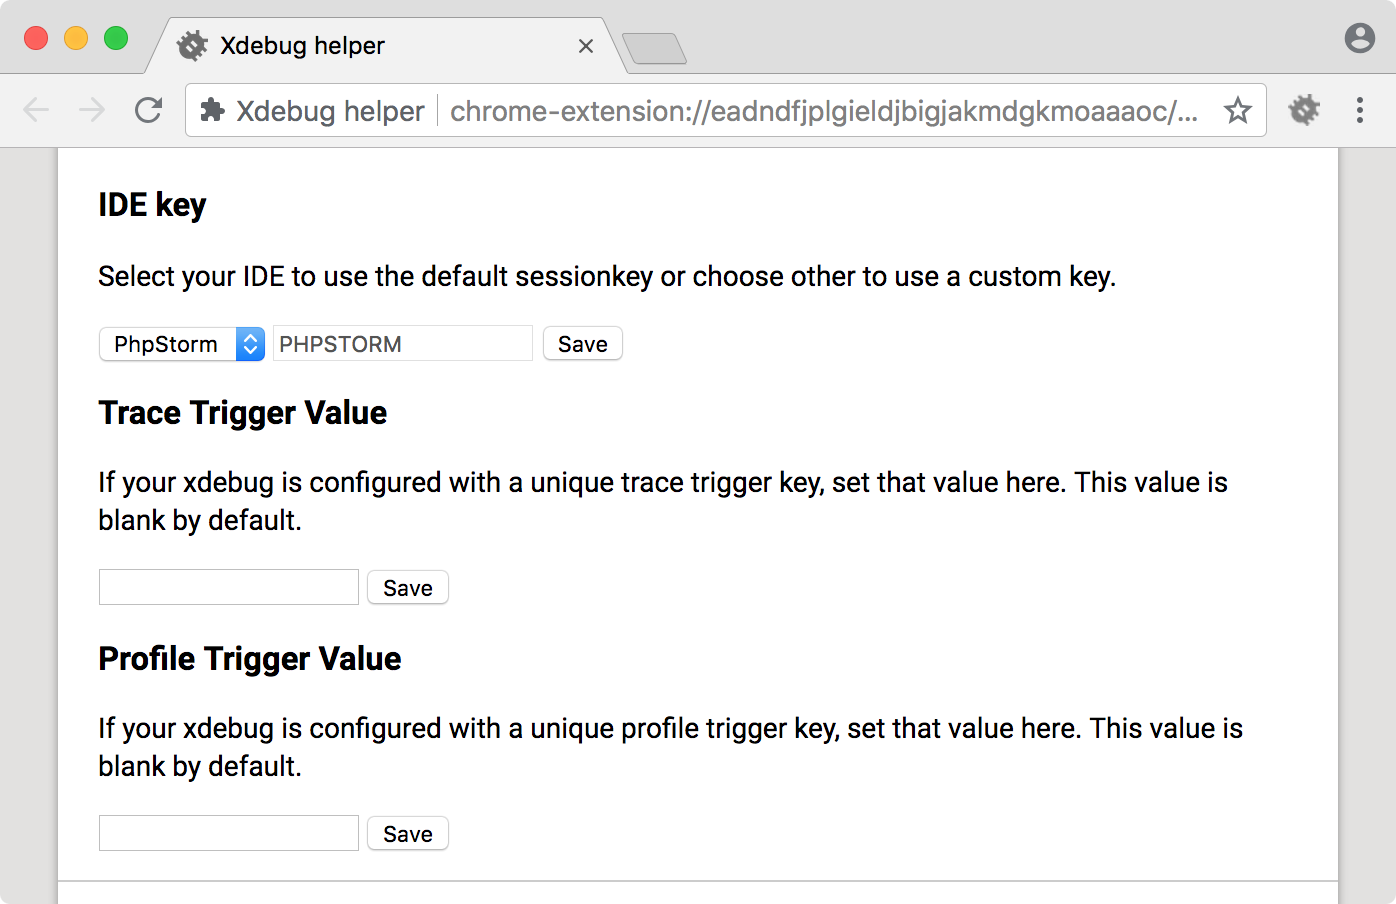
As a rule, no further configuration is required. If necessary, you can explore additional settings by right-clicking the Xdebug Helper icon and choosing Options from the context menu.

To configure Zend Debugger Toolbar for Firefox
Install Zend Debugger Toolbar.
In PhpStorm, enable listening to incoming debug connections by either clicking
 on the toolbar or selecting
 -
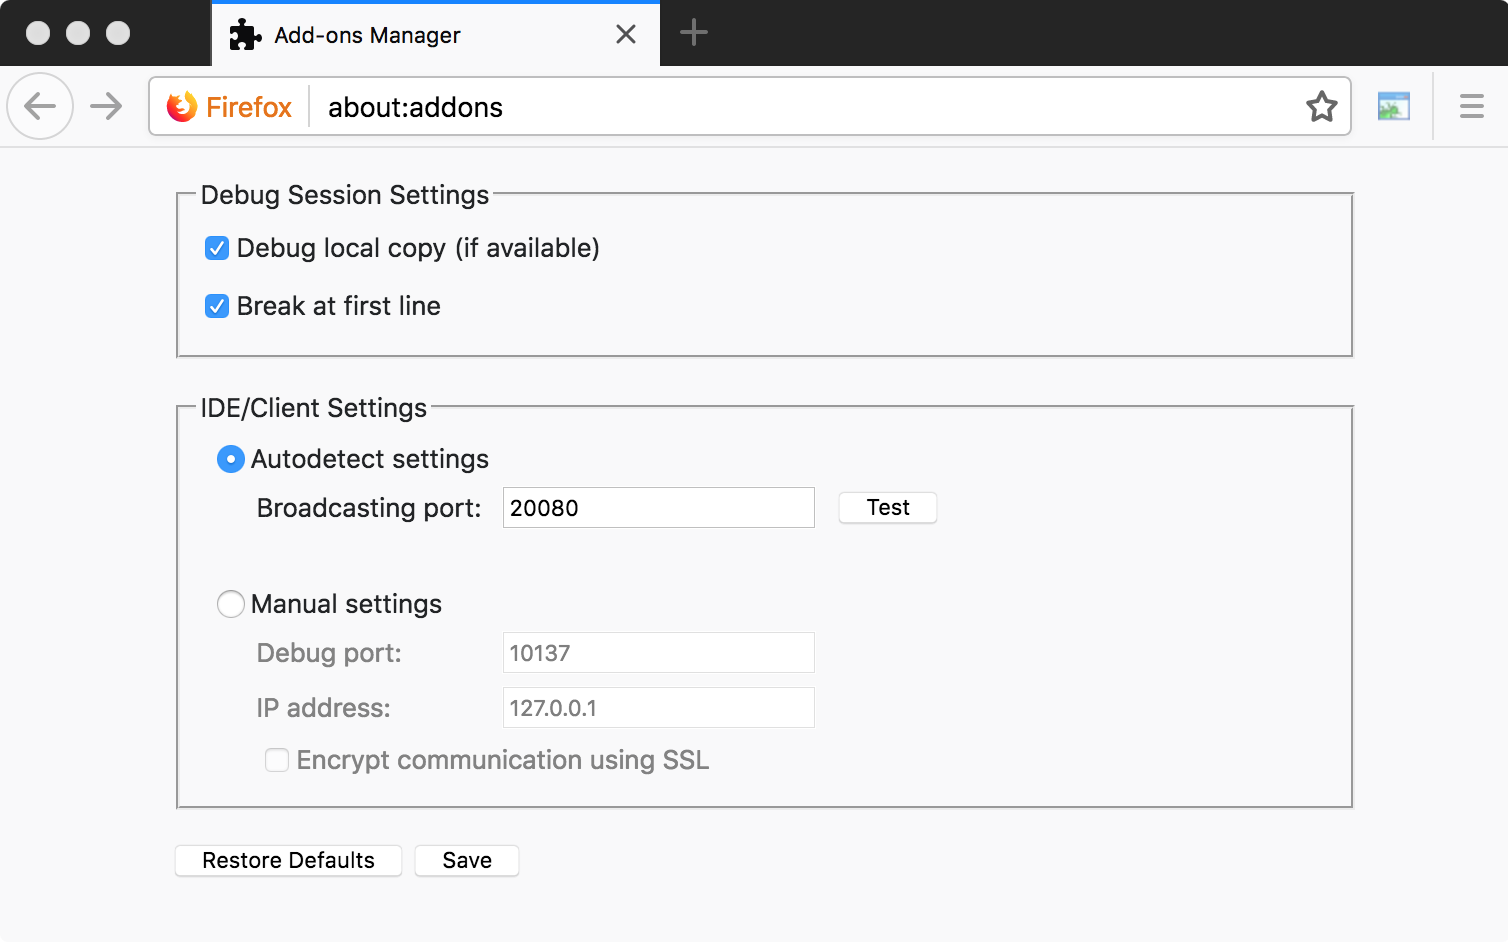
In the browser, click the Zend Debugger icon on the toolbar and select Settings. Make sure that Autodetect is selected, and the Broadcasting port value matches the value set for Settings broadcasting port on the Debug page in PhpStorm.

-
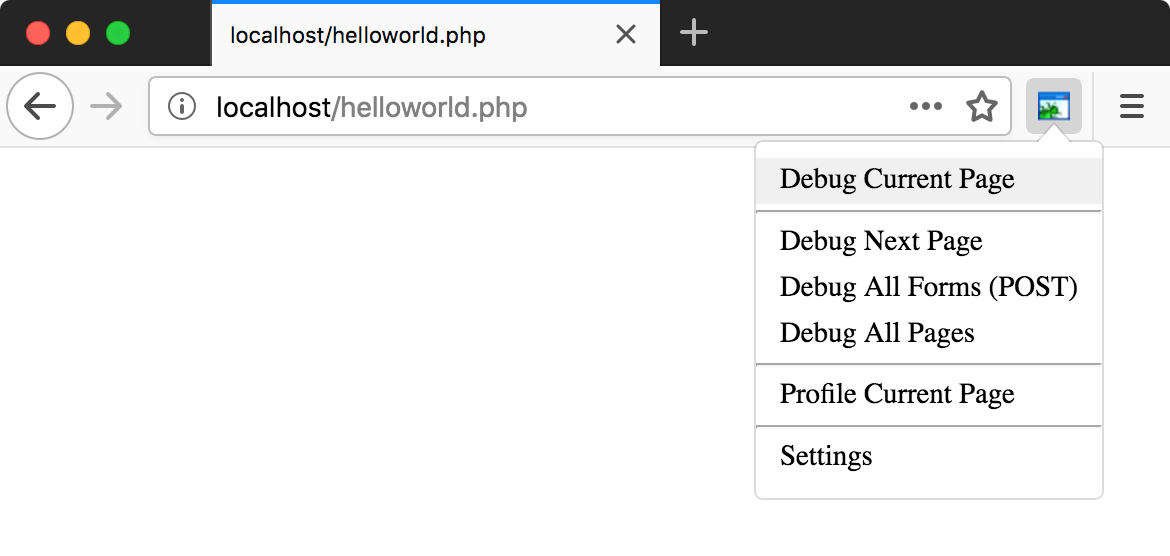
Initiate connection from the browser side. Click the Zend Debugger icon on the browser toolbar to initiate a debugging or profiling session:
