HTTP Client
With the HTTP Client plugin, you can create, edit, and execute HTTP requests directly in the PhpStorm code editor.
There are two main use cases when you need to compose and run HTTP requests:
When you are developing a RESTful web service and want to make sure it works as expected, is accessible in compliance with the specification, and responds correctly.
When you are developing an application that addresses a RESTful web service. In this case, it is helpful to investigate the access to the service and the required input data before you start the development. During development, you may also call this web service from outside your application. This may help locate errors when your application results in unexpected output while no logical errors are detected in your code, and you suspect that the bottleneck is the interaction with the web service.
HTTP requests are stored in .http and .rest files and are marked with the ![]() icon.
icon.
Support for HTTP files includes the following features:
Code completion for hosts, method types, header fields, and endpoints defined via OpenAPI
Code folding for requests, their parts, and response handler scripts
Reformat requests according to your HTTP Request code style.
Inline documentation for request header fields and doc tags
Viewing the structure of HTTP request files
Language injections in Web languages inside the request message body
If necessary, before you begin, configure the Proxy settings on the HTTP Proxy page of the Settings dialog (Ctrl+Alt+S) .
Watch this video for a quick HTTP Client overview:
Create HTTP request files
You can work with HTTP requests either from scratch files or from physical files of the HTTP Request type. Each file can contain multiple requests, and you can create as many files as needed.
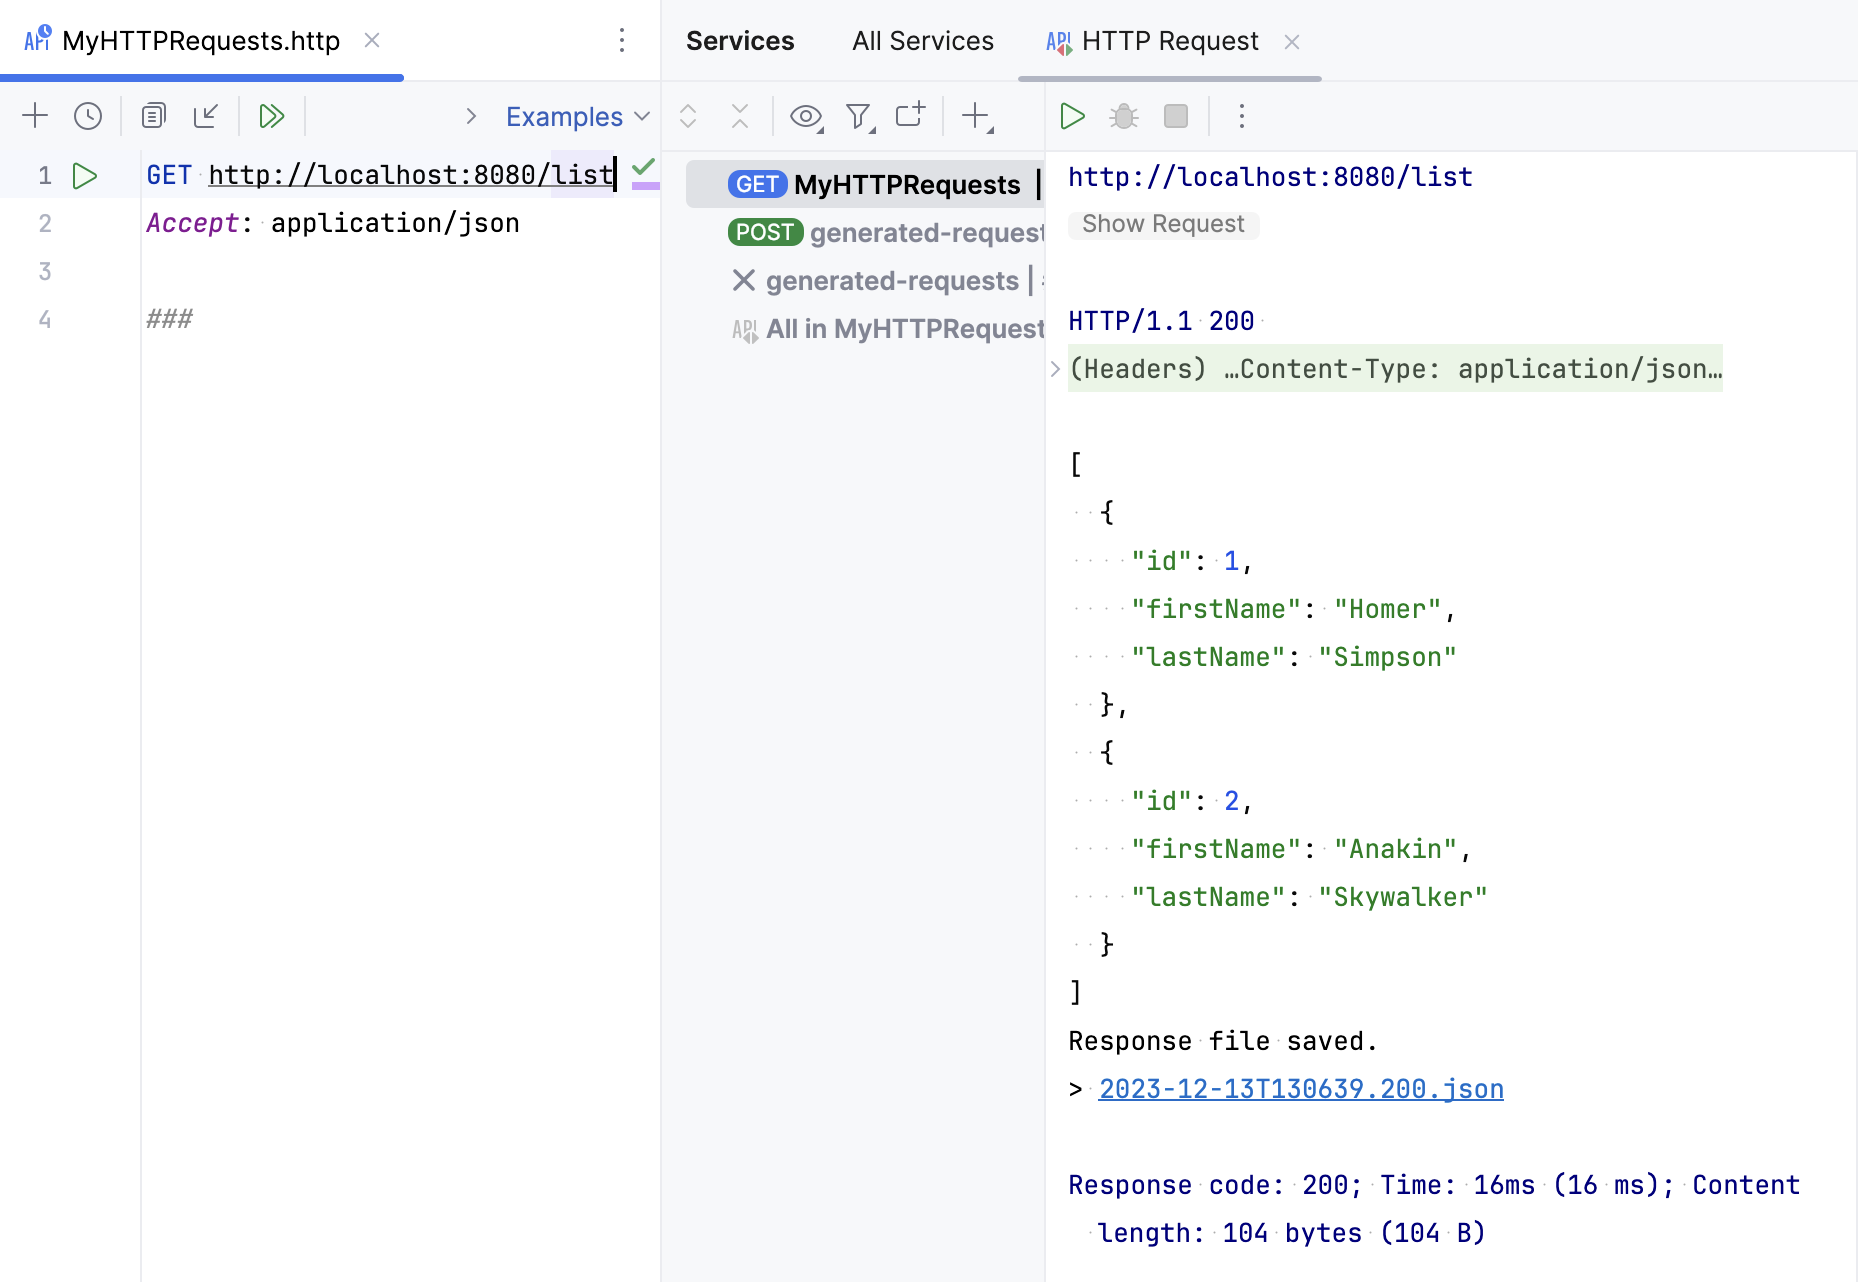
Scratch files can be used to test HTTP requests during development. Scratch files are not stored inside a project, so PhpStorm can modify them and add additional information about the request. When an HTTP request is executed from a scratch file, the link to the response output file is added below the request and at the top of the requests history file.
Create an HTTP request scratch file
Press Ctrl+Alt+Shift+Insert and select HTTP Request.
Physical files can be used for documenting, testing, and validating HTTP requests. Physical files are stored inside your project, and PhpStorm will not modify them. When an HTTP request is executed from a physical file, this file is not modified. Information about the executed request with the link to the response output file is added to the top of the requests history file.
Create a physical HTTP request file
In the File menu, point to New, and then click HTTP Request.
Move an HTTP request
You can use the Move refactoring F6 to move HTTP requests from scratches to physical files, as well as between physical files.
In the editor, place the caret at the request to be moved and do one of the following:
From the main menu or the context menu, select .
Press Alt+Enter and select the Move HTTP Requests intention action.
Press F6.
In the Move HTTP Requests dialog that opens, do the following:
In the Path field, choose one of the existing .http files from the list or click
 to locate the file.
You can also type the full path to the file manually. If you specify the name of a non-existing file, a new file with the provided name will be created automatically.
In the Requests list, select the checkboxes next to the requests you want to move.

Compose HTTP requests
PhpStorm uses the HTTP request in Editor format, which provides a simple way to create, execute, and store information about HTTP requests. You can type them directly in the created HTTP request files using the following general syntax:
After the ### separator, you can enter any comments preceded by # or //.
To speed up composing HTTP requests, you can:
Click . If a request file is opened in the editor, this will add a request template to the opened file. Otherwise, this will create a new .http scratch file.
Click
 on top of the request's editor panel. In the popup menu, select the type of the request to add.
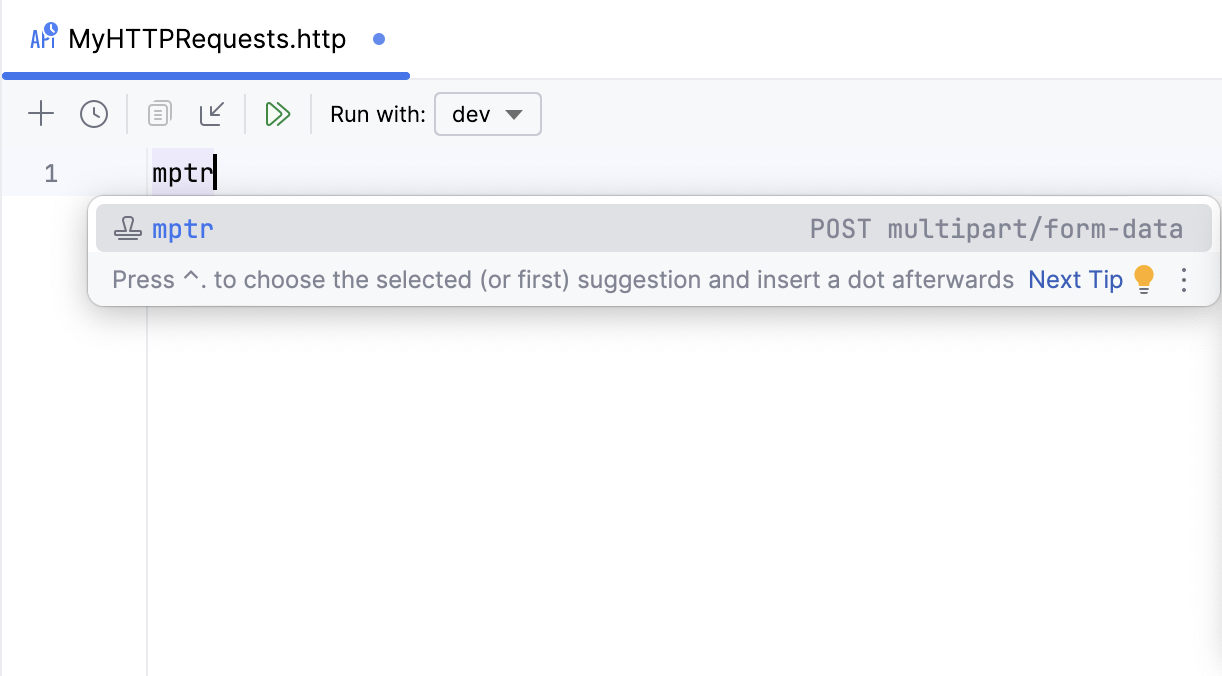
Alternatively, use live templates. In the editor, you can press Ctrl+J to view the list of available templates. For example, gtr expands to a simple GET request; mptr expands to a multipart/form-data POST request.
Create custom HTTP methods
If a web service requires you to use custom HTTP methods, you can add such methods to PhpStorm and use them in your HTTP requests.
In an .http file, type a custom method in uppercase letters.
When this method is highlighted as unknown, press Alt+Enter (Show Context Actions) and select Add custom HTTP method.

PhpStorm will now recognize it as a valid HTTP method. You can find all custom HTTP methods (and add new ones) in the IDE settings (Ctrl+Alt+S), under .
HTTP/2
Starting with version 2024.1, PhpStorm provides support for HTTP/2 in HTTP requests. You can specify the HTTP version after the URL part, for example:
If no version is specified, the HTTP Client attempts to use HTTP/2 for secure connections (and falls back to HTTP/1.1 if HTTP/2 negotiation fails) and HTTP/1.1 for non-secure connections.
Select HTTP version
After the request URL, put a white space and press Ctrl+Space or start typing
HTTP.From the completion list, select one of the suggested values:
HTTP/1.1to enforce the use of HTTP/1.1.HTTP/2to enable the use of HTTP/2.HTTP/2 (Prior Knowledge)to send using HTTP/2 without HTTP/1.1 Upgrade. Use it if you know your server can handle HTTP/2 connections.

To get an overview of the HTTP Client features, you can explore the HTTP Requests Collection, which is a handful selection of composed requests.
Open a request from the HTTP Requests Collection
Click the Examples shortcut link on top of the request's editor panel.
In the popup menu, choose the HTTP Requests collection you wish to open:

Convert cURL requests
If you are working with cURL requests, you can convert between cURL requests and the HTTP request in Editor format.
Convert cURL to HTTP request
Paste the cURL request into an HTTP request file. PhpStorm will convert it to the HTTP request format and leave the original cURL request commented out for later reference.

Alternatively, click
 on top of the HTTP request editor panel and select Convert cURL to HTTP Request.
In the Convert cURL to HTTP Request dialog, type or paste the cURL request that you want to convert.

Consider the following example cURL request:
PhpStorm will convert it to the following:
The converter supports the following cURL options:
Option | Description |
|---|---|
The request method to use. | |
The request header to include in the request. | |
The user's credentials to be provided with the request, and the authorization method to use. | |
The data to be sent in a POST request. | |
The multipart/form-data message to be sent in a POST request. | |
The URL to fetch (mostly used when specifying URLs in a config file). | |
Defines whether the HTTP response headers are included in the output. | |
Enables the verbose operating mode. | |
Enables resending the request in case the requested page has moved to a different location. |
Convert HTTP request to cURL
Place the caret at the HTTP request that you want to convert to cURL format.
Press Alt+Enter and select Convert to cURL and copy to clipboard.
Alternatively, you can click the Convert shortcut link on top of the HTTP request editor panel and select Convert HTTP Request Under Caret to cURL and Copy.
This will generate a cURL request based on the HTTP request and copy it to the clipboard.
Import Postman collections and environments
Postman collections is a way to group related HTTP requests together. In Postman, you can export collections as well as variables in JSON format. With the HTTP Client, you can import such files to PhpStorm to convert them to the respective .http and environment files.
Import Postman collections to HTTP Client
Export a collection from Postman. You can also export environment files if you want to use them in PhpStorm.
Import the file to PhpStorm in one of the following ways:
If the exported file is in your project, right-click it and select Convert Collection to .http File.
Open any .http file, click
in the toolbar, and select Postman Collection.Press Ctrl+Shift+A, start typing
Import from Postman Collection File, and select the corresponding action.
If you also want to import an environment file, select Attach environment and specify the file. It will be converted to the HTTP Client environment format, and this environment will be selected for the specified .http file.
In the window that appears, click Convert.

Create requests from OpenAPI specifications
When working with OpenAPI Specification files, you can create HTTP requests to the specified endpoints.
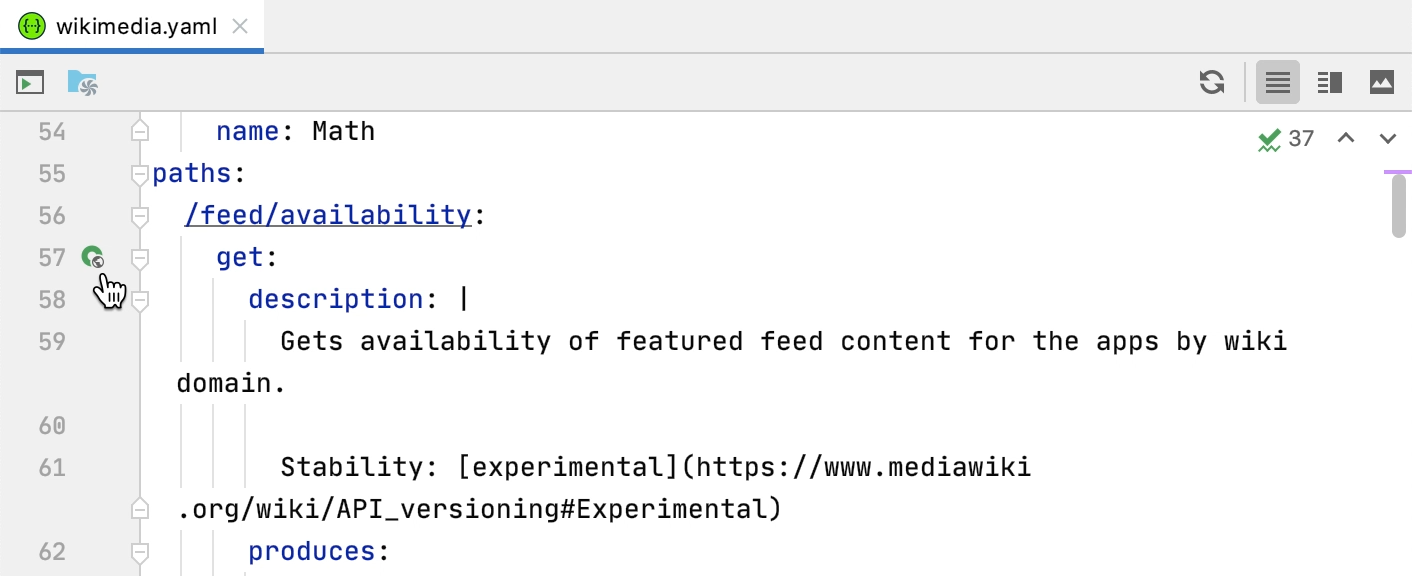
Create an HTTP request to an endpoint
In an OpenAPI specification file, click
 in the editor gutter next to the endpoint definition.
Alternatively, open , right-click an endpoint, and select Generate Request in HTTP Client.
PhpStorm will create a new HTTP request and save it in the generated-requests.http scratch file.
If you want to quickly send a request to an endpoint and do not want to save it, you can use the HTTP Client tab in the Endpoints tool window.
PhpStorm provides completion for the request URL and for the request body (in JSON format) based on the available OpenAPI specifications. This applies not only to local, but also to remote specifications (add them in the IDE settings to enable completion).
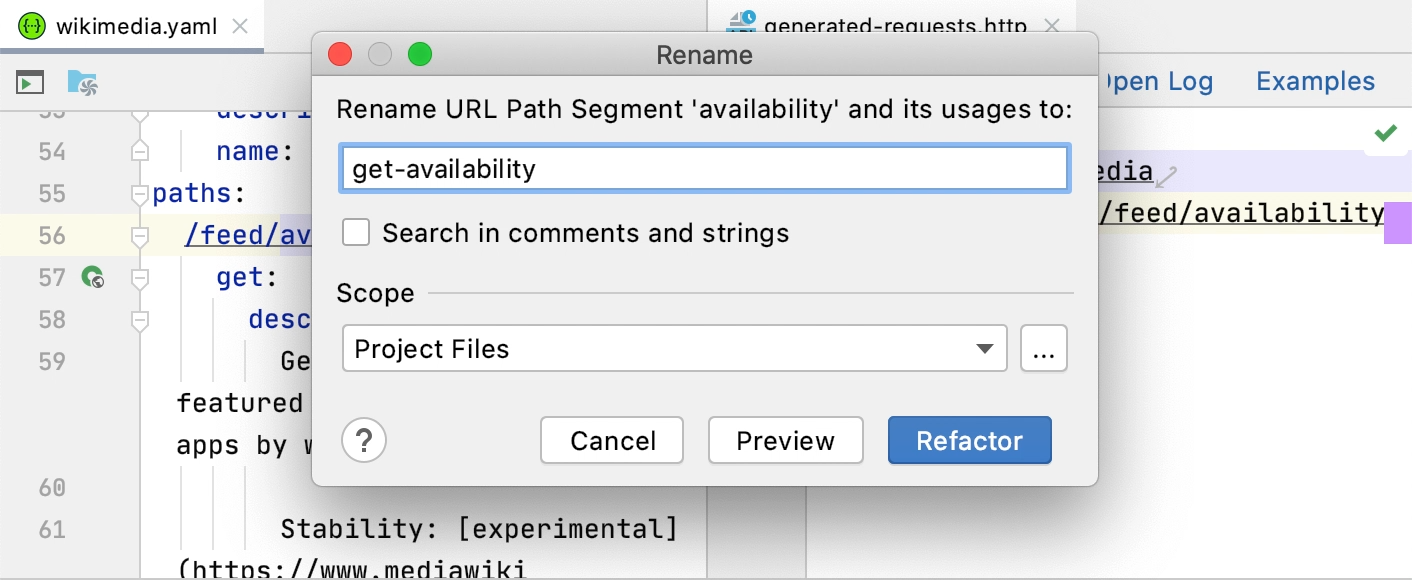
Rename an endpoint and its usages
Use the Rename refactoring to rename the defined endpoint and its usages in HTTP requests simultaneously.
Do any of the following:
In an OpenAPI specification file, place the caret at the endpoint's definition you want to rename.
In an HTTP request file, place the caret at the URL path segment you want to rename.
Select from the main menu or the context menu, or press Shift+F6.
In the Rename dialog that opens, specify the new endpoint's name.
Preview and apply changes.
PhpStorm will rename the endpoint and its usages.
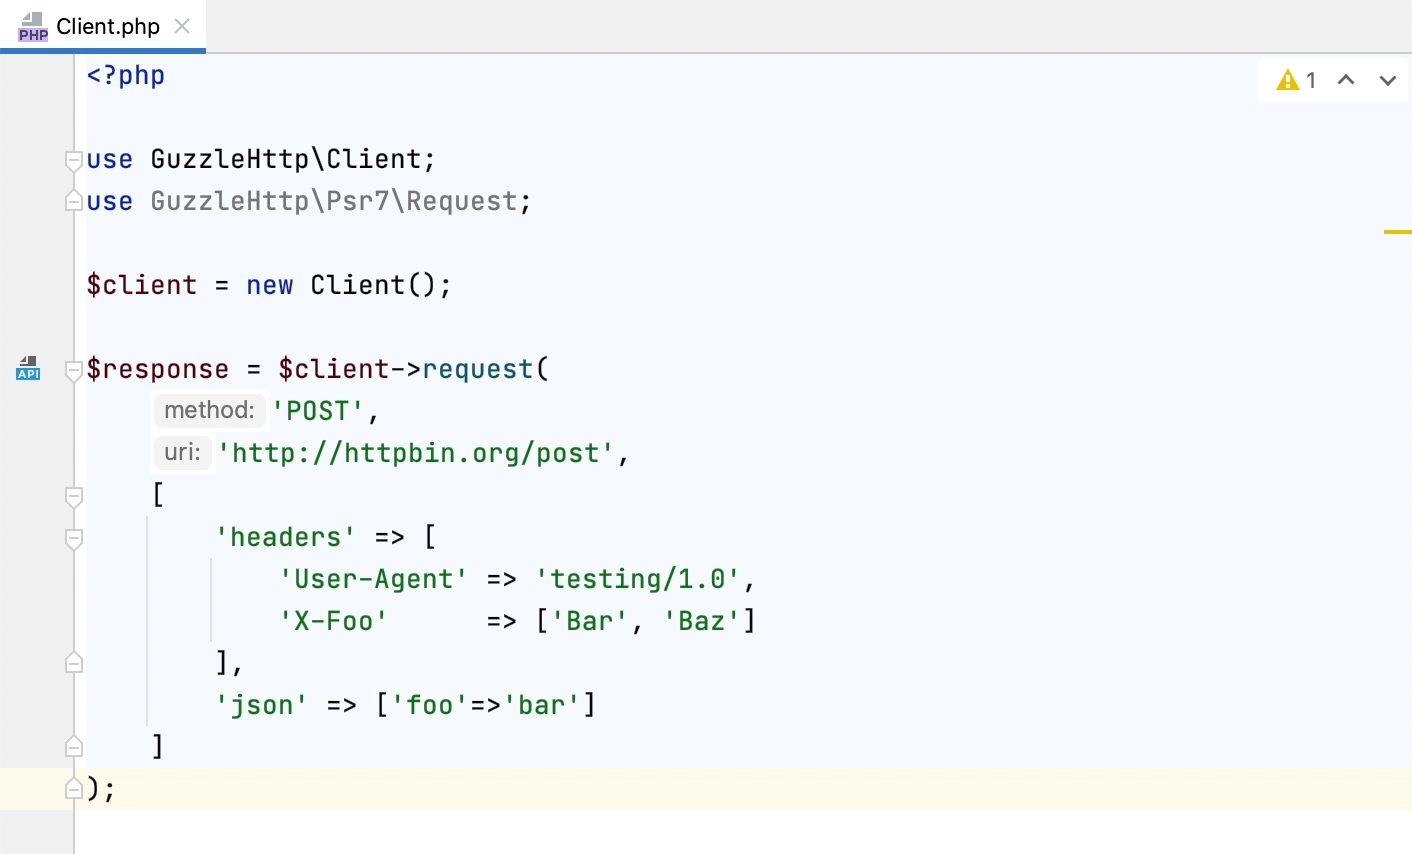
Create and run Guzzle requests
If you use the Guzzle PHP HTTP client in your project, you can test HTTP requests in the editor without running the actual code.
If PhpStorm can infer a URL and HTTP method from code, the HTTP Request icon ![]() is displayed in the editor gutter.
is displayed in the editor gutter.
Click
 to create an HTTP scratch file and open it in the editor. The created file has the name of the original PHP file with the Guzzle request and contains prefilled request details such as basic authentication fields, request body, headers, and query parameters.
In the HTTP scratch file, place the caret at the request you want to execute, press Alt+Enter and select Run <request name>. Alternatively, click
 in the editor gutter. For more information, refer to Execute HTTP requests.
Use response handler and pre-request scripts
With response handler scripts, you can programmatically react to a received HTTP response. By using these scripts, you can automatically process the received data as well as validate it against the conditions that you specify. Response handler scripts are provided as a part of the request within the HTTP request file and are executed as soon as a response is received. To view the response handling examples, open the Requests with Authorization or Requests with Tests and Scripts requests collections.
With pre-request scripts, you can set variables used in HTTP requests.
Insert response handler scripts
You can insert a response handler script into your request in-place or by referring to an external file.
To insert the script in-place, prepend it with
>and enclose it in{% %}:GET host/api/test > {% // Response Handler Script ... %}To insert the script from an external file, prepend it with
>:GET host/api/test > scripts/my-script.js
If there is any output from the response handler script (errors or output from client.log), it is shown in the Response Handler tab of the Services tool window when you run the request.
Insert pre-request scripts
You can insert a pre-request script into your request in-place or by referring to an external file.
To insert the script in-place, prepend it with
<and enclose it in{% %}:< {% request.variables.set("petName", "Bella") %} POST https://example.org/pets/{{petName}}To insert the script from an external file, prepend it with
<:< scripts/my-script.js POST https://example.org/pets/{{petName}}
If there is any output from the pre-request script (errors or output from client.log), it is shown in the Pre-request Handler tab of the Services tool window when you run the request.
Import JavaScript code
Sometimes, you may need to use specific functionalities, such as variables or functions, from external files. For this, in pre-request and response handler scripts, you can use the regular ES6 import feature to access variables and functions defined in local JavaScript files.
Export the needed values from a JavaScript file. The HTTP Client supports
exportstatements in the following formats:export let name1, name2/*, … */; // also var export const name1 = 1, name2 = 2/*, … */; // also var, let export function functionName() { /* … */ } export { name1, /* …, */ nameN }; export { variable1 as name1, variable2 as name2, /* …, */ nameN }; export default expression; export default function functionName() { /* … */ } export default function () { /* … */ }Import the needed values into your response handler or pre-request script. The HTTP Client supports
importstatements in the following formats:import defaultExport from "module-name"; import * as name from "module-name"; import { export1 } from "module-name"; import { export1 as alias1 } from "module-name"; import { export1, export2 } from "module-name"; import { export1, export2 as alias2, /* … */ } from "module-name"; import defaultExport, { export1, /* … */ } from "module-name"; import defaultExport, * as name from "module-name"; import "module-name"; // side effect import
Response handler scripts and pre-request scripts are written in JavaScript ECMAScript 2023, with coding assistance and documentation handled by the bundled HTTP Pre-Request and Response Handler library. For in-place scripts, this functionality is enabled automatically. For external scripts, you need to enable it manually.
Enable JavaScript coding assistance for response handler and pre-request scripts
Press Ctrl+Shift+A (Find Action).
Type Use JavaScript Library, click the corresponding action, and, in the context menu that opens, select HTTP Pre-Request and Response Handler.
The HTTP Response Handler library exposes two objects to be used for composing response handler scripts:
The
clientobject stores the session metadata, which can be modified inside the script. Theclientstate is preserved until you close PhpStorm. Every variable saved inclient.globalasvariable_nameis accessible to subsequent HTTP requests as{{variable_name}}.responseholds information about the received response: its content type, status, response body, and so on.
To open the HTTP Response Handler library in the editor, place the caret at the library object and press Ctrl+B.
Response handler scripts can include tests, which lets you use the HTTP Client as a testing framework. To create a test, invoke the client.test(testName, function) method. Inside the test, you can assert a condition by invoking the client.assert(condition, message) method, for example:
Navigate through .http file using the Structure tool window
If you have multiple requests in your .http file, the Structure tool window can be useful to quickly preview the file and navigate through it. The tool window also shows the request parts, such as headers, the request bodies, pre-request scripts, and response handler scripts.
Open the Structure tool window: .
Alternatively, press Alt+7.
In the Structure tool window, click an HTTP method or request name, or any part of the request.

You can also send requests from there by right-clicking it and selecting ![]() .
.
Execute HTTP requests
Execute single request
If you are going to test your own web service, make sure it is deployed and running.
If you have environments defined, select an environment in the Run with list on top of the request's editor panel.
In the gutter, click
 next to the request.
Execute multiple requests sequentially
You can run all requests from your .http file at once. This can be useful for complex scenarios such as requesting particular data from a server, saving it as a client.global variable, and sending a subsequent request containing that data.
Open an .http file.
On top of the editor panel, click
 (Run All Requests in File).
Debug HTTP requests
Besides debugging the entire application, you can debug separate HTTP Requests. This is helpful when you are actually interested in a specific page that is accessed in a number of steps, but for this or that reason you cannot specify this page as the start page for debugging, for example, because you need to "come" to this page with certain data.
Make sure to perform the preparatory steps as described in Debug a PHP HTTP request:
Set a breakpoint in the source file of an endpoint you plan to debug.
Place the caret at the request and press Alt+Enter or click
in the editor gutter. From the popup menu, select PHP Debug <host>.
If you have environments defined, select PHP Debug with ... and choose the environment in the popup menu. The selected environment will be used as the default one when executing or debugging the request later.

PhpStorm will automatically add the
XDEBUG_SESSIONcookie to the request, execute it, and stop at the specified breakpoint.
When a request is executed, PhpStorm automatically creates a dedicated temporary HTTP Request run/debug configuration for it. You can save it as a permanent run/debug configuration if necessary.
Open a request in the browser
You can open an HTTP request in the browser specified on the Web Browsers and Preview page of the Settings dialog (Ctrl+Alt+S) .
Press Alt+Enter and select the Open in web browser intention action.
Work with HTTP request run/debug configurations
When you execute an HTTP request from the editor, PhpStorm automatically creates a temporary run/debug configuration with the request parameters. A temporary run/debug configuration works the same way as a permanent run/debug configuration. You can change its settings using the Run/Debug Configuration dialog and optionally save it as permanent.
Modify an HTTP Request run/debug configuration
Do any of the following:
In the editor, right-click a request and in the context menu, select Modify Run Configuration....
Alternatively, go to in the main menu, and select the required run/debug configuration from the HTTP Request list.
Change the configuration parameters where necessary:
In the Environment list, select an environment that will define the set of environment variables used in the request.
In the File field, provide the path to the HTTP request file. You can type the path manually and use path completion Ctrl+Space as you type, or click
 and select the required folder in the dialog that opens.
If your request file contains multiple requests, in the Request list, choose the name of the request to execute.
Save a temporary HTTP Request run/debug configuration
Do any of the following:
In the Run/Debug Configuration selector, choose .
In the Run/Debug Configuration dialog, select the configuration and click
 .
.
Execute a request using a run/debug configuration
Do any of the following:
In the Run/Debug Configuration selector, select the desired run configuration. Then click
on the main toolbar or press Shift+F10.Press Alt+Shift+F10, select the desired run configuration from the list, and press Enter.

Import HTTP requests from other .http files
PhpStorm lets you import HTTP requests from other .http files. You can:
Click Examples and select Requests with Include to get syntax examples for this feature in your IDE.
Run all requests from another .http file
In your .http file, enter
runfollowed by the name of another .http that you want to include. If the file is in the same directory, enter its name. Otherwise, specify a path to it. For example:run ./myFolder/get-requests.httpClick
next to runto send all the requests from this file.
Run specific requests from another .http file
At the top of your .http file, enter
importfollowed by the name of another .http that contains necessary requests.Enter
runand specify the name of the request that you want to run.You can press Ctrl+Space to view all the requests available in the imported file.

Override variables from imported .http files
If the imported .http file contains variables, you can specify or change their values for specific executions.
Enter
runand specify the name of an .http file or a request.After the name of a request or a file, enter variables in the
(@variable=value)format. To specify multiple variables, separate them by commas. For example:import new-requests.http run #GET request with one var (@host=example.com) run #GET request with two vars (@host=example.com, @user=userName)
View responses from web services
When you execute an HTTP request, PhpStorm automatically saves the response into a separate file under the .idea/httpRequests/ directory. You can view the 50 most recently stored responses and navigate to the corresponding files using the requests history. If the request was executed from a scratch file, the link to its response output is also added below the original request:

View a received response
Switch to the Services tool window, which opens automatically as soon as a response is received.
By default, the server response is shown in the format specified in the request header via the content-type field. To have the response converted into another format, click
 and select Text, JSON, XML, or HTML.
If the response contains a binary file, this file is also saved under the .idea/httpRequests/ directory. If the response is an image, PDF, or HTML file, you can preview them right in the IDE.
Preview the image the Services tool window:

Preview the PDF file the Services tool window. To disable showing PDF preview in the Services tool window, click ![]() and clear the Enable PDF preview inline option.
and clear the Enable PDF preview inline option.

If the response is an HTML file, you can click Show Preview to preview it in the editor tab using the JCEF-based browser.

If you have a response handler script, the results of the tests executed as part of this script are displayed in the Tests tab of the Services tool window. You can click each of the tests to quickly navigate to the test source code in the corresponding response handler script.

If you subscribe to an event stream, PhpStorm displays events in the Services tool window. Here, you can also view the status of the client-server connection and terminate it by clicking ![]() . Depending on the content type (either
. Depending on the content type (either text/event-stream or application/x-ndjson), the response will be formatted as plain text or newline-delimited JSON. You can write a response handler script to process each line of the event stream.

Redirecting stream events to a file is currently not supported.
Open a response file in the editor
Place the caret at the link to the response you want to open.
Do one of the following:
In the main menu, go to .
Press Ctrl+B or F4.
In the Services tool window or in the editor (for scratch files), Ctrl+Click the link in the response line.
Extract data from JSON response using JSONPath
The HTTP Client supports JSONPath queries, enabling you to parse and extract data from received JSON documents. To do this, use the following function in your response handler script:
Use the jsonPath live template to quickly insert this function.
After the request, in the response handler script part, start typing
> jsonPath.Press Enter to expand the live template and complete the JSONPath expression.
For example, this expression will retrieve and print the value of the
titlefield of the first element within theslidesarray, which is a part of theslideshowobject:GET https://examples.http-client.intellij.net/json > {% client.log(jsonPath(response.body, "$.slideshow.slides[0].title",)) %}Preview the obtained value in the Response Handler tab of the Services tool window.
Extract data from XML response using XPath
The HTTP Client supports XPath expressions, enabling you to parse and extract data from received XML documents.
In your response handler script, use the following function:
xpath(XMLToParse, XPathExpression)In
XMLToParseenter the XML content to be parsed (for example,response.body), and inXPathExpressionenter your XPath expression.
For example:
Compare responses in a scratch file
When a request is executed from a scratch file, the link to the response output file is added below the original request.
Do any of the following:
Place the caret at the link to the response file. Press Alt+Enter and select the Compare with <response name> intention action.
Click
 in the gutter and select Compare with <response name> from the list:
Compare responses in the request history
When a request is executed from a physical file, the link to the response output is added to the requests' history.
Place the caret at the link to the response file. In the main menu, go to , or press Ctrl+B or F4 to open this file in a new editor tab.
Go to in the main menu, or press Ctrl+D. PhpStorm will prompt you to open a response file from the httpRequests folder.
Select the response file you would like to compare the current file with and click Open.
The two response files will be opened in the Diff Viewer allowing you to compare their contents:

View request history
PhpStorm automatically saves the 50 recently executed requests into the http-requests-log.http file, which is stored on the project level under the .idea/httpRequests/ directory. With requests history, you can quickly navigate to a particular response as well as issue any request again. If a request is issued again from the request history, its execution information and the link to the response output are added to the top of the request history file.
Open request history
Click
 on top of the request's editor panel.
Select from the main menu.
Redirect output to a custom file or directory
The HTTP Client can redirect output to a custom file or directory. It supports two operators for force and soft redirects:
The
>>operator always creates a new file, adding an-nsuffix to a filename if the requested filename already exists.The
>>!operator rewrites the file if it already exists.
Manage cookies
The cookies received through a response are automatically saved into the dedicated http-client.cookies file under the .idea/httpRequests/ directory. The number of cookies that can be saved is limited to 300. The name and value of a cookie are automatically included in each subsequent request to the URL that matches the domain and path specified for the cookie, provided that the expiry date has not been reached.
If you want a cookie to never expire, you can enter -1 as the date parameter. For example:

If you want to set custom cookies in an HTTP request, you can use the Cookie header. Enter your cookies as a list of name=value pairs separated by a semicolon, for example:
WebSocket requests
The HTTP Client supports WebSocket requests. For the HTTP Client to treat your request as a WebSocket request, start it with the WEBSOCKET keyword followed by a server address. The request has the following structure:
To speed up composing a WebSocket request, you can:
Click
on top of the editor panel of an .http file and select WebSocket Request.In an .http file, type
wsrand press Enter to apply the WebSocket live template.
Send multiple messages
Use the
===separator to send multiple messages:{ "message": "First message sent on connection" } === // message separator { "message": "Second message" } === { "message": "Third message" }
Send messages after the server response
Before a message, enter
=== wait-for-server.This will make the HTTP Client wait for the server response before sending the message. You can wait for multiple responses by repeating the
=== wait-for-serverline. For example, the following message will be sent after 3 server responses:=== wait-for-server === wait-for-server === wait-for-server { "message": "This messages is sent after 3 server responses" }
Send messages interactively
Once you have initiated a connection, you can interact with your server right from the Services tool window. You can send messages and view server responses to each new message.
In the Services tool window, select an opened connection.
In the lower part of the window, under Message to be sent to WebSocket, enter the message content.
To the right of it, select the message format: plain text, JSON, XML, or HTML.
Press Ctrl+Enter to send the request.
In the upper part of the window, you'll see the server response.

GraphQL
PhpStorm provides support for sending GraphQL operations in the HTTP request body. You can send them over HTTP or WebSocket.
Compose an HTTP request with GraphQL query
In an .http file, enter the
GRAPHQLkeyword followed by a server address.In the request body, compose your GraphQL operation (query, mutation, or subscription), for example:
### HTTP request with GraphQL query GRAPHQL http://localhost:8080/graphql query { toDos { title, completed, author { username } } }
To speed up composing an HTTP request with a GraphQL query, you can:
Click
on top of the editor panel of an .http file and select GraphQL Query Request.In an .http file, type
gqlrand press Enter to apply the GraphQL live template.
Use GraphQL variables
In the HTTP request body, you can use GraphQL variables if you want to pass some dynamic data separately from the query string.
After the query part, enter a JSON variables dictionary:
query ($name: String!, $capital: String!) { country(name: $name, capital: $capital) { name capital } } { "name": "France", "capital": "Paris" }You can also use HTTP Client environment variables as GraphQL variable values. For example, in this JSON,
"{{Author}}"is an environment variable; its value at runtime depends on the environment that you select while sending the request:{ "author": "{{Author}}" }
Configure proxy settings
In the Settings dialog (Ctrl+Alt+S) , choose System Settings under Appearance & Behavior, then choose HTTP Proxy.
In the HTTP Proxy dialog that opens, select Manual proxy configuration and specify the following:
Enter the proxy host name and port number in the Host name and Port number fields.
To enable authorization, select the Proxy authentication checkbox and type the username and password in the corresponding fields.
Set up client SSL/TLS certificate
If an HTTP server requires SSL/TLS authentication for secure communication, you may need to specify the client certificate before sending an HTTPS request. In the HTTP Client, you can set up the client certificate using the private environment file.
Specify path to certificate
In an .http file, in the Run with list, select Add Environment to Private File.
In the http-client.private.env.json file that opens, add the
SSLConfigurationobject to the needed environment. InclientCertificate, enter a path to your client certificate. If a certificate key is stored in a separate file, enter its path inclientCertificateKey. For example:{ "dev": { "MyVar": "SomeValue", "SSLConfiguration": { "clientCertificate": "cert.pem", "clientCertificateKey": "MyFolder/key.pem" } } }Alternatively, you can describe
clientCertificateandclientCertificateKeyas objects, which lets you specify the certificate format in addition to the path. For example:{ "dev": { "SSLConfiguration": { "clientCertificate": { "path": "file.crt", "format": "PEM" }, "clientCertificateKey": { "path": "file.key", "format": "DER" } } } }
Set up a certificate passphrase
If you used a passphrase when generating your client certificate, you should provide it to the HTTP Client.
In the http-client.private.env.json file, add
"hasCertificatePassphrase": trueto theSSLConfigurationobject, for example:{ "dev": { "SSLConfiguration": { "clientCertificate": "file.crt", "hasCertificatePassphrase": true } } }Click
 in the gutter or, with the caret placed at
 hasCertificatePassphrase, press Alt+Enter and select Set value for 'Certificate passphrase'.In the window that opens, enter your certificate passphrase.

You can omit the second step if you do not want to enter the passphrase now. In this case, PhpStorm will prompt you to enter the passphrase when you execute an HTTPS request.
Disable certificate verification
For development purposes, you may have a host with self-signed or expired certificates. If you trust this host, you can disable verification of its certificate.
In the http-client.private.env.json file, add
verifyHostCertificate": falseto theSSLConfigurationobject. For example:{ "sslTest": { "SSLConfiguration": { "verifyHostCertificate": false } } }
If you run a request with this environment, PhpStorm will not verify host certificates.