Debug a PHP CLI script
PHP applications are not always web applications. Various command line tools, daemons, message queue processing applications and other types of applications typically run in the PHP CLI. There are several ways to start a PHP CLI debugging session. You can start it from within PhpStorm and make it start the script and attach the debugger to it. Alternatively, you can let PhpStorm listen for incoming debugger connections and start the script outside the IDE. We'll take a look at both options.
Before you start debugging, make sure that you have a debugging engine installed and configured properly. PhpStorm automates the process of getting Xdebug up and running. On your first attempt to run a debugging session without a debugger installed, the IDE will prompt you to download and install the relevant version of Xdebug.

Click Download and install the Xdebug extension to have PhpStorm download Xdebug and modify the relevant PHP configuration file. If you want more control over the installation process, click Generate installation script and run the commands manually.
Alternatively, you can install and configure the debugging engine manually as described in Configure Xdebug and Configure Zend Debugger.
Start a debugging session from PhpStorm
To start debugging a PHP CLI script from within PhpStorm, perform the following steps.
Create a Run/Debug Configuration
PhpStorm uses Run/Debug configurations to execute a script from within the IDE. A configuration can define additional arguments for the PHP interpreter as well as launch other commands prior to starting our script. We will need a Run/Debug configuration to start the debugger from within PhpStorm.
Create a Run/Debug configuration for a PHP script manually
Create a new Run/Debug configuration using the menu.
Add a new configuration of the PHP Script type and provide the required parameters, such as the script to be executed.
Save the created Run/Debug configuration.
Generate a Run/Debug configuration for a PHP script
Right-click in the Project tool window, and select from the context menu (make sure to pick the item marked with
 ). Alternatively, open the script in the editor, press Alt+Shift+F9, and select the script to be debugged.
The IDE will launch the script with the debugger enabled, and open the Debug tool window.
Launch the Debugger
Before launching the debugger, make sure that either a breakpoint is set or the Break at first line in PHP scripts option is enabled on the Debug page of the Settings dialog Ctrl+Alt+S.
Click
 on the PhpStorm toolbar.
Press Alt+Shift+F9.
Select from the main menu.
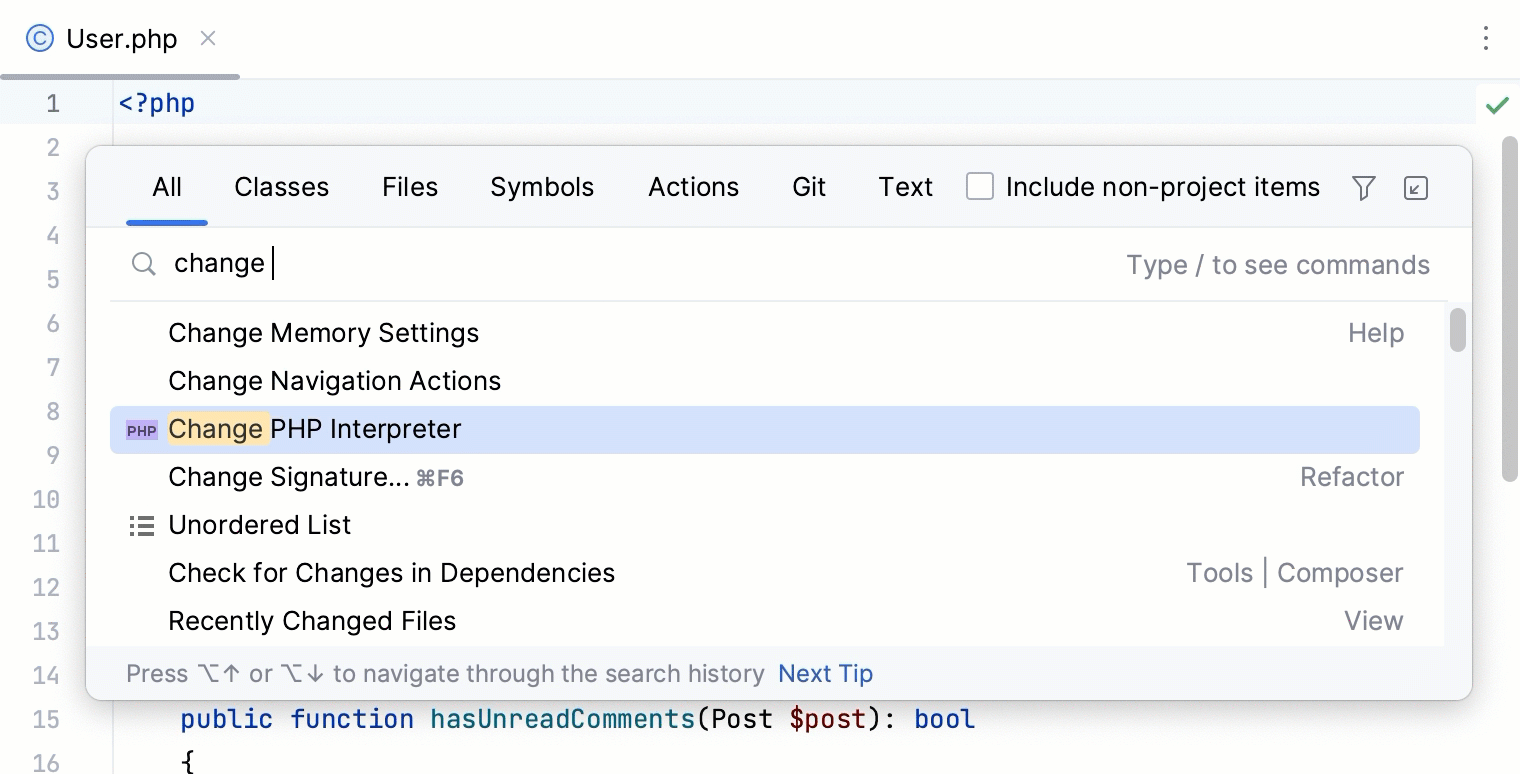
Switch between configured PHP interpreters on the fly
Press Ctrl+Shift+A and start typing
Change PHP interpreter. In the suggestion list, select the Change PHP interpreter action.If necessary, you can assign a keyboard shortcut for this action either directly in the suggestions list by pressing Alt+Enter, or at a later point as described in Keyboard shortcuts.
In the popup menu that opens, select one of the configured local or remote PHP interpreters.
The selected interpreter will be set as the default project interpreter on the PHP page of the Settings dialog (Ctrl+Alt+S) . This will also affect configurations that use the default project interpreter (test frameworks, quality tools, and run/debug configurations) and commands run in the PhpStorm terminal.
Start a debugging session from the command line
Before you start a debugging session with PhpStorm when running CLI scripts, make sure that any of the following requirements is met:
Xdebug's
remote_autostart(for Xdebug 2) orstart_with_request(for Xdebug 3) option is enabled.XDEBUG_CONFIGenvironment variable exists.
Listening for incoming debugger connections
In PhpStorm, enable listening to incoming debug connections by either clicking ![]() on the toolbar or selecting . This will ensure PhpStorm reacts when a debugging session is started and opens the debug tool window automatically. Before launching the script, make sure that either a breakpoint is set or the Break at first line in PHP scripts option is enabled on the Debug page of the Settings dialog Ctrl+Alt+S.
on the toolbar or selecting . This will ensure PhpStorm reacts when a debugging session is started and opens the debug tool window automatically. Before launching the script, make sure that either a breakpoint is set or the Break at first line in PHP scripts option is enabled on the Debug page of the Settings dialog Ctrl+Alt+S.
Start the script with debugger options
Since we'll be starting the script from the command line, we will have to make sure it is started with the required settings to enable the debugger.
Starting the script with Xdebug
Xdebug has various configuration options which we can use to let the PHP interpreter reach out to PhpStorm. These parameters have to be passed to the PHP interpreter using the -d command line parameter. Alternatively, you can set an environment variable so that you don't need to provide the -d parameters every time.
Start the script with debugging using PHP command-line switches
Launch PHP with the following command-line options:
php -d xdebug.mode=debug -d xdebug.client_host=127.0.0.1 -d xdebug.client_port=9003 -d xdebug.start_with_request=yes path/to/script.phpphp -d xdebug.remote_enable=1 -d xdebug.remote_mode=req -d xdebug.remote_port=9000 -d xdebug.remote_host=127.0.0.1 -d xdebug.remote_connect_back=0 path/to/script.php
Start the script with debugging using an environment variable
Set an environment variable that configures Xdebug:
For Windows:
set XDEBUG_MODE=debug& set XDEBUG_SESSION=1set XDEBUG_CONFIG=remote_enable=1 remote_mode=req remote_host=127.0.0.1 remote_port=9000 remote_connect_back=0For macOS / Linux
export XDEBUG_MODE=debug XDEBUG_SESSION=1export XDEBUG_CONFIG="remote_enable=1 remote_mode=req remote_host=127.0.0.1 remote_port=9000 remote_connect_back=0"
Start the script normally:
php path/to/script.phpOptionally, you can use Xdebug's remote_autostart (for Xdebug 2) or start_with_request (for Xdebug 3) setting to always start a debugging session for every script that is run.
Starting the script with Zend Debugger
Zend Debugger has various configuration options which we can use to let the PHP interpreter reach out to PhpStorm. These parameters have to be passed to the PHP interpreter using an environment variable.
Start the script with debugging
Set the
QUERY_STRINGenvironment variable:set QUERY_STRING=start_debug=1&debug_host=127.0.0.1&no_remote=1&debug_port=10137&debug_stop=1export QUERY_STRING="start_debug=1&debug_host=127.0.0.1&no_remote=1&debug_port=10137&debug_stop=1"Start the script normally:
php path/to/script.php
Optionally, to tell PhpStorm which path mapping configuration should be used for a connection from a certain machine, the value of the PHP_IDE_CONFIG environment variable should be set to serverName=SomeName, where SomeName is the name of the server configured on the page of the Settings dialog (Ctrl+Alt+S) .
Debug
Once the script is started, PhpStorm will open the Debug tool window and break at the first breakpoint that was set in the script. You can now continue debugging a PHP CLI script as described in Examine a suspended program.
If the script that is being debugged is not a part of the project that's open in PhpStorm, the IDE will still open the script in the editor and pause execution at the first statement. This makes it possible to quickly debug any PHP CLI script, even if there is no PhpStorm project for it yet.