PHP command line tools
PhpStorm supports running commands of popular third-party or user-defined PHP tools: Symfony 1.1+, Symfony2, Zend Framework 1, Zend Framework 2 (ZFTool), Yii, Composer, Drush 5.8+, Laravel and Doctrine (Symfony console-based), WordPress Command Line Interface.
Enable the PHP Command Line Tool plugin
This functionality relies on the PHP Command Line Tool plugin, which is bundled and enabled in PhpStorm by default. If the relevant features are not available, make sure that you did not disable the plugin.
Press Ctrl+Alt+S to open settings and then select .
Open the Installed tab, find the PHP Command Line Tool plugin, and select the checkbox next to the plugin name.
Integrate an external PHP command line tool with PhpStorm
Download and install the tool.
In the Settings dialog (Ctrl+Alt+S) , go to .
Click
 on the toolbar.
In the Command Line Tools dialog, choose the tool from the list, and specify its visibility level (Project or Global).

When you click OK, the tool settings dialog opens. In this dialog, set up the tool execution.
Click OK to apply changes and return to the PHP Command Line Tool Support page. Optionally, click
 to edit the tool properties, or
  to customize the commands set. For more information, refer to Customize a tool.
Run commands
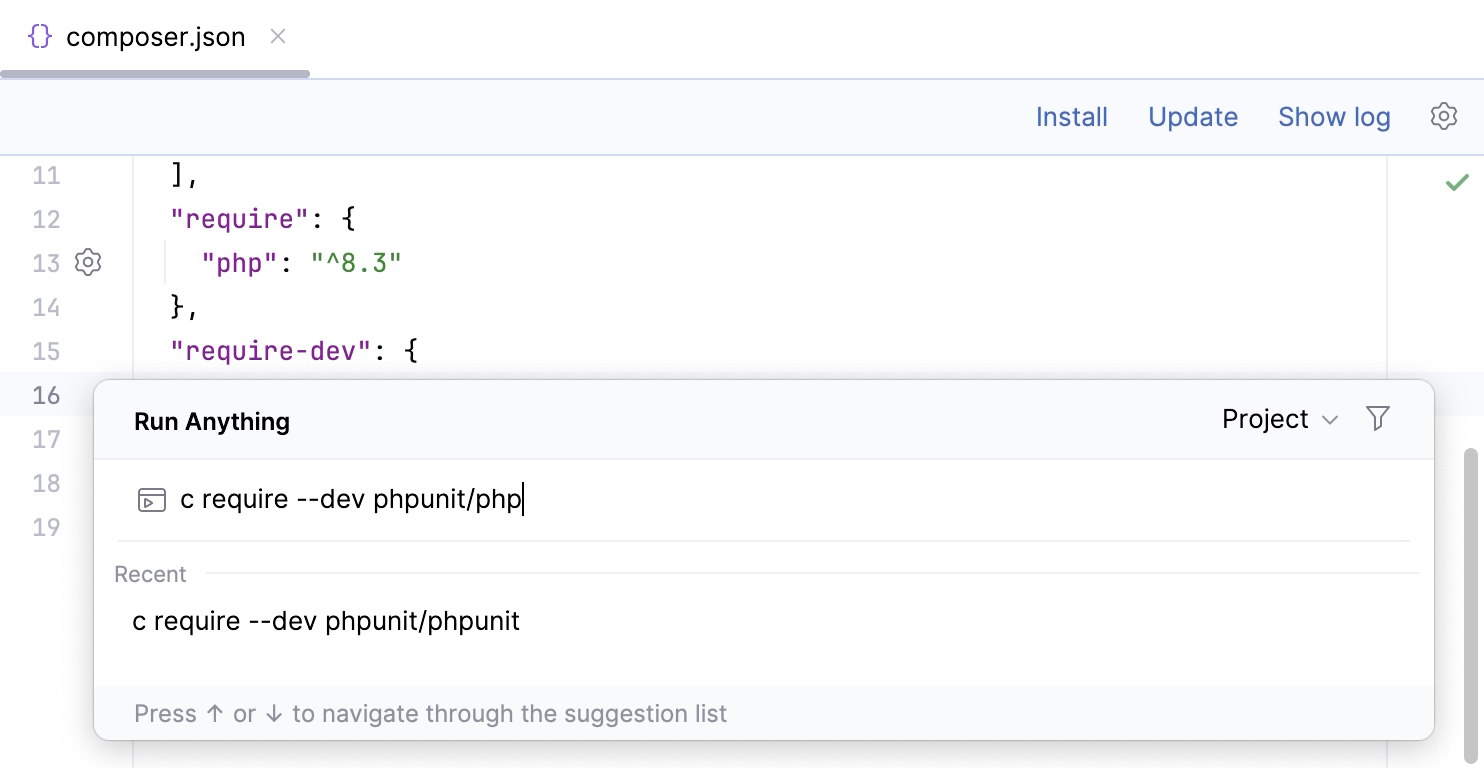
Run a command
Go to or press Ctrl twice.
In the Run Anything window that opens, type the call of the command in the
<default alias> <command>format.The command execution result is displayed in the Run tool window.
Terminate a command
Click
 on the Run tool window toolbar.
Customize a tool
In the Settings dialog (Ctrl+Alt+S) , go to .
On the PHP Command Line Tools Support page, select the tool in the list and click
on the toolbar. The xml tool descriptor opens in the editor.Update the definitions of the commands (for more information, refer to Define your own command line tool). As you type, the tool descriptor is checked for well-formedness on the fly.
Reload the command definitions. On the PHP Command Line Tools Support page of the Settings dialog (Ctrl+Alt+S) , select the tool in the list and click
 on the toolbar.
Define your own command line tool
In the Settings dialog (Ctrl+Alt+S) , go to .
Click
on the toolbar and in the Command Line Tools dialog that opens, select Custom tool from the Choose tool list, and specify the visibility level for it (Project or Global).In the Tool Settings dialog, type the path to the tool and the tool alias.
When you click OK, PhpStorm brings you to the PHP Command Line Tools Support page, where the new tool is added to the list.
Click OK to accept the changes and close the Settings dialog.
The tool definition xml file automatically opens in the editor, letting you define the tool commands.
A command's definition is organized as follows:
<command> <!--the command's container--> <name> <!--the command itself, mandatory, and non-empty--> </name> <help> <!--the command's help message, optional--> </help> <params> <!--the command's parameters and their default values--> </params> <optionsBefore> <!--the command's options container--> <option name="" shortcut=""> <!--the option itself, mandatory, and non-empty; you can also provide a shorthand abbreviation and the usage pattern via attributes--> <help> <!--the command's help message, optional--> </help> </option> </optionsBefore> </command>Reload the command definitions. On the PHP Command Line Tools Support page of the Settings dialog (Ctrl+Alt+S) , select the tool in the list and click
on the toolbar.
See Tutorial: integrating the Yii command line tool with PhpStorm for the step-by-step guide on integrating a custom Yii command line tool with PhpStorm.
Keep a tool descriptor consistent
Every time you edit a command definition in the xml tool descriptor, PhpStorm checks it for well-formedness on the fly. Full validation is performed every time you invoke a command.
If any inconsistencies are detected, an error message in displayed in the Run tool window.
Verify the tool definition
In the Settings dialog (Ctrl+Alt+S) , go to . The tools having an inconsistent descriptor are marked with
 .
.
Select the tool in the list and click
on the toolbar. The xml tool descriptor opens in the editor.Update the definitions of the commands as required. For more information, refer to Define your own command line tool.
Custom Tools Command Definitions
The following table lists several custom command line tools provided by third-party developers.
Tool | Author |
|---|---|