Run inspections
PhpStorm analyses code in the files that are opened in the editor and highlights problematic code as you type. Additionally, you can run the necessary inspection or a set of inspections on the selected scope of files manually. In this case, you will get a comprehensive report of all problems detected in the files.
Instant analysis of the current file
The IDE continuously checks your code and searches for problems. The widget in the top-right corner of the editor displays the number of problems of each severity detected in the current file:
![]()
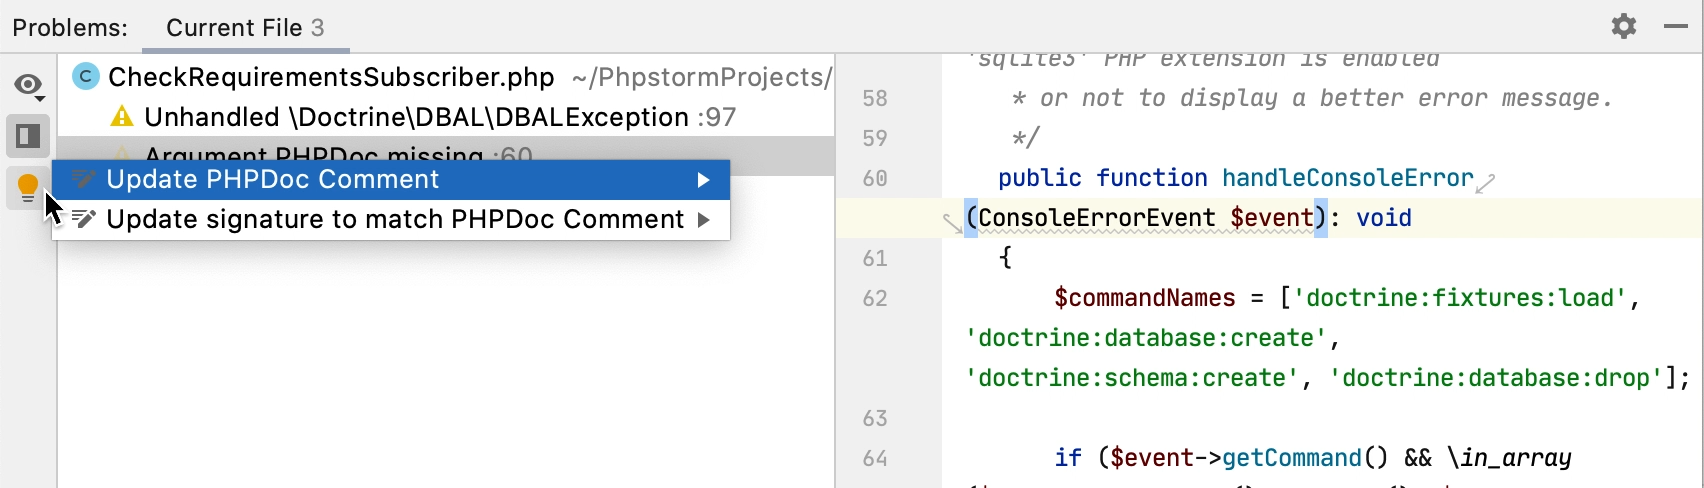
Click the widget to open the list of problems on the Current File tab of the Problems tool window. You can also access the Problems tool window by selecting or by pressing Alt+6.
For each problem, you can see the suggested quick-fix by pressing Alt+Enter or by clicking ![]() . You can also jump to the corresponding line in the editor by pressing F4 or by double-clicking the problem in the tool window.
. You can also jump to the corresponding line in the editor by pressing F4 or by double-clicking the problem in the tool window.
Alternatively, click ![]() to be able to view and fix problems in the tool window.
to be able to view and fix problems in the tool window.
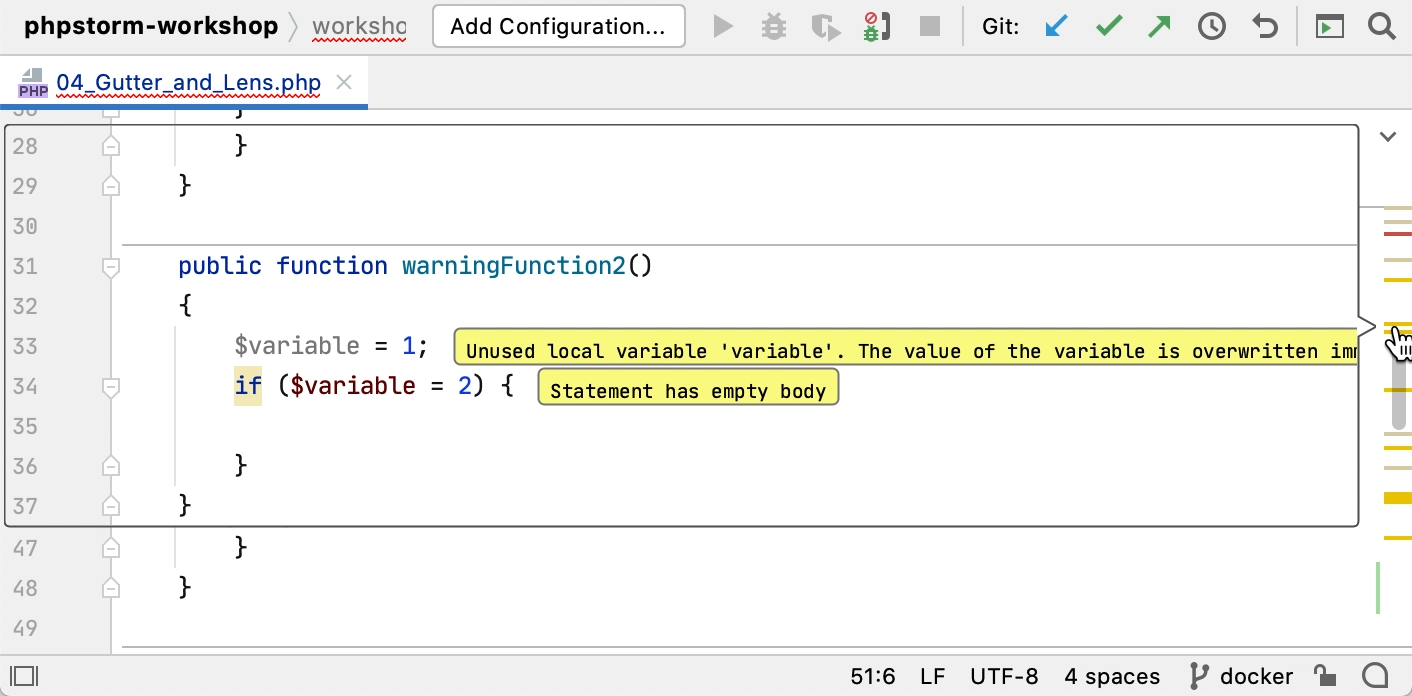
The color stripe in the scrollbar also marks detected code problems and helps you quickly access the corresponding lines without scrolling the file. Hover over a mark on the stripe to see the detected problem in a tooltip. Click a mark to jump to the corresponding line.
Navigate to detected problems
You can jump from one highlighted problem to another within a file by clicking ![]()
![]() in the widget or by pressing F2 or Shift+F2 accordingly. By default, the IDE will navigate you to problems according to their severity: errors > warnings > weak warnings > server problems > typos.
in the widget or by pressing F2 or Shift+F2 accordingly. By default, the IDE will navigate you to problems according to their severity: errors > warnings > weak warnings > server problems > typos.
You can configure PhpStorm to take you through the problems one by one regardless of their severity. Hover the mouse over the widget in top-right corner of the editor, click ![]() , select 'Next Error' Action (F2) Goes Through, and enable All Problems.
, select 'Next Error' Action (F2) Goes Through, and enable All Problems.

Run inspections manually
Some inspections require global code analysis, and that is why they are disabled in the editor. These inspections are listed in . Click ![]() and select Show Only Batch-Mode Inspections.
and select Show Only Batch-Mode Inspections.
If you want to get a full report of all detected problems, run inspections manually.
Run all inspections
From the main menu, select .
Select the scope of files that you want to analyze. You can also click
 and configure a new scope.
Select the inspection profile that you want to apply. To configure a new profile, click
in the Inspection profile area.Click OK to start the analysis.
Run a single inspection
Running a single inspection is useful in case you want to track a specific problem. If you find a warning in a file, you can inspect your entire project, or the necessary scope of files, to ensure that there are no more such warnings in your code base.
From the main menu, select (Ctrl+Alt+Shift+I).
Type the inspection name in the popup. Use CamelHumps to match camel case words and white spaces with initial letters of the words. The suggestion list will show you inspections that match your search request.
If you are not sure that you are selecting the correct inspection, you can view its description. To do so, select an inspection in the popup and press Ctrl+Q.
Double-click the necessary inspection to open its settings.
In the dialog that opens, select the scope of files that you want to analyze.
The File Masks(s) option helps you narrow down the number of files that will be inspected.
Select the checkbox and specify a pattern of characters and wildcards that matches the names of files you want to analyse. Use a comma to separate multiple file masks.
Some inspections might have additional options that you will be prompted to configure.
These settings will only be applied to this run, and will not affect this inspection's configuration in your current profile.
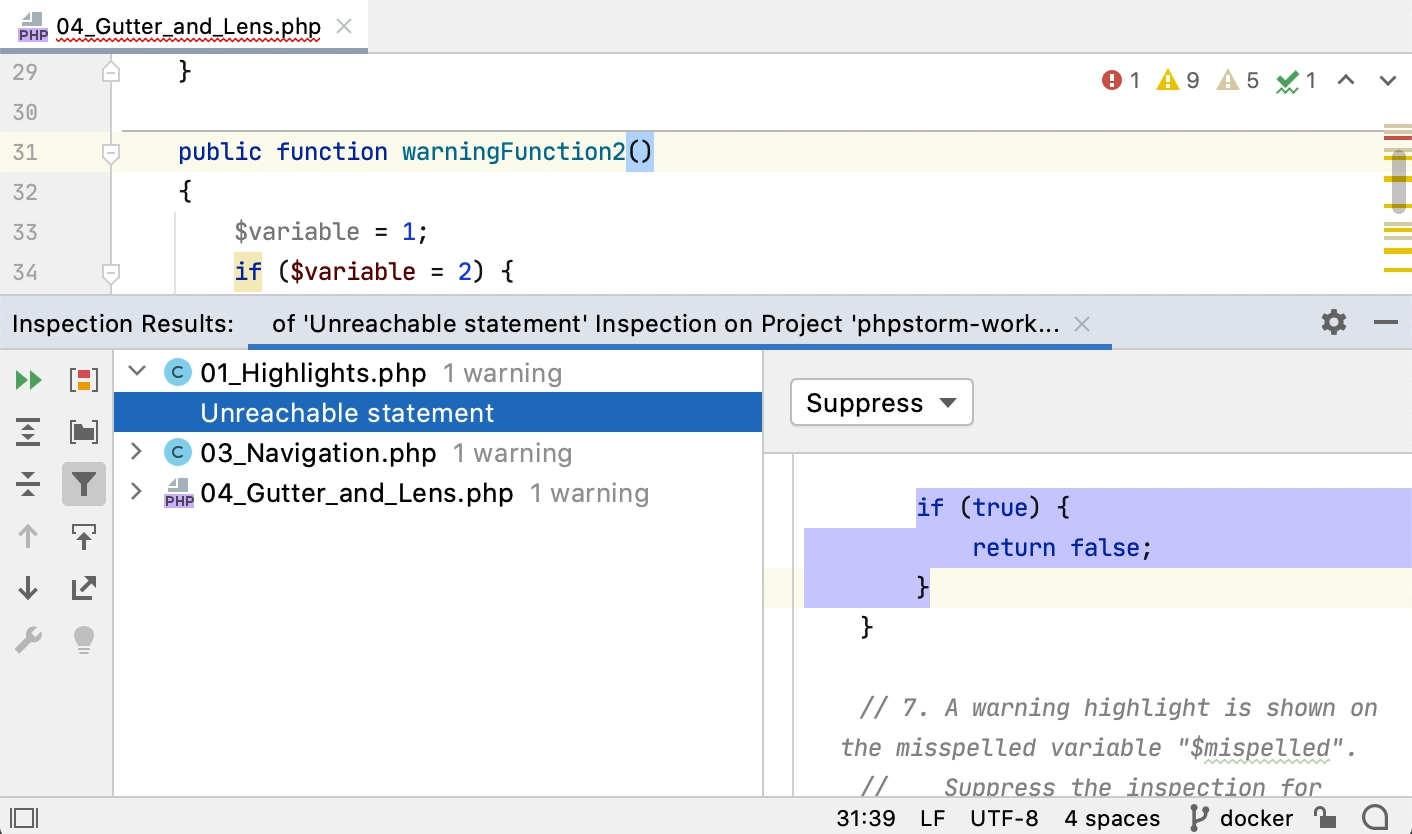
The IDE will show you the inspection results in the dedicated tool window. There you can examine and fix detected problems.
Analyze code before committing it to Git
If your project is under Git version control, you can configure the IDE to analyze modified files before committing them.
Press Ctrl+K or select from the main menu.
In the Commit tool window, click
 and in the Before commit area, select the Analyze code checkbox.
Alternatively, if you're using the Commit Changes dialog, in the Before Commit area, select the Analyze code checkbox.
Click Configure and select the required inspection profile from which the IDE will run inspections.


Click Commit.
PhpStorm analyzes the code from the modified files by running inspections from the selected profile.
If any errors or warnings are detected, you will see a notification.

In the notification, click Review to see the list of the detected problems in the Messages tool window. Click Commit to commit your changes without fixing the detected problems.
Run inspections offline
In addition to running code inspections from the IDE, you can launch inspections from the command line without actually running PhpStorm. The inspection results will be stored in an XML file. For more information, refer to Run code inspections from the command line.
Change the order of scopes
By default, all enabled code inspections analyze all files in your project. Depending on your needs, you can run the same inspection in more than one scope of files with different settings.
If one file is included in two or more scopes, and you enable an inspection in these scopes, PhpStorm will process them according to their order in the list of scopes — the uppermost scope will have the highest priority, and therefore, it will be analyzed first.
In the Settings/Preferences dialog Ctrl+Alt+S, select .
Select any inspection from the list.
From the In All Scopes list, select Edit Scopes Order.
Select the necessary scope, and use
 and
and  to move it up and down the list.
If needed, create a new scope. To do so, click
 (Edit Scopes), specify scope settings, and select the files and folders that you want to include in it. See Scopes and file colors for details.