Module Dependency Diagrams
With PhpStorm, you can get visualization of imports and exports within a context in JavaScript and TypeScript projects.
Build module dependency diagrams
Choose from the context menu of a JavaScript, TypeScript, or HTML file or from the context menu of a folder.
The action is not available for node_modules and for
Excludedfolders.If the action is invoked on a folder where multiple types of diagrams can be built, additionally choose from the Select Diagram Type list.
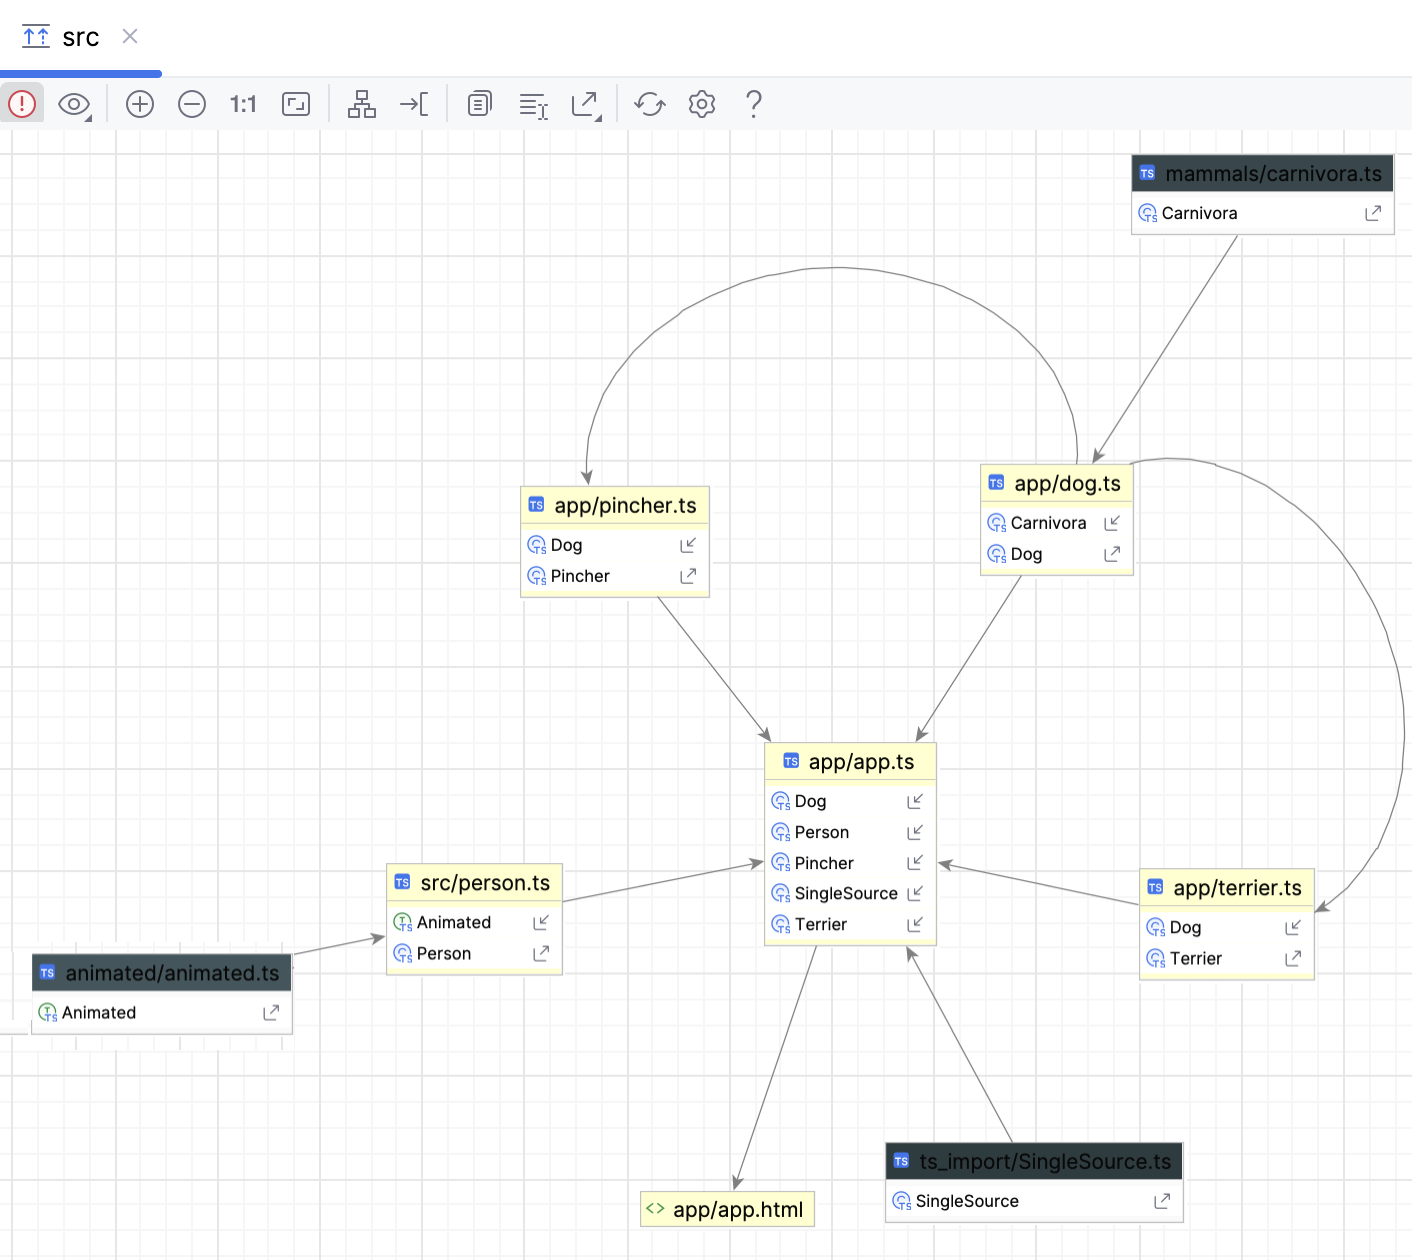
PhpStorm analyzes the import and require statements and script tags in the selected file or in all the files in the selected folder recursively and in a separate tab displays a diagram that shows how these files depend on each other:
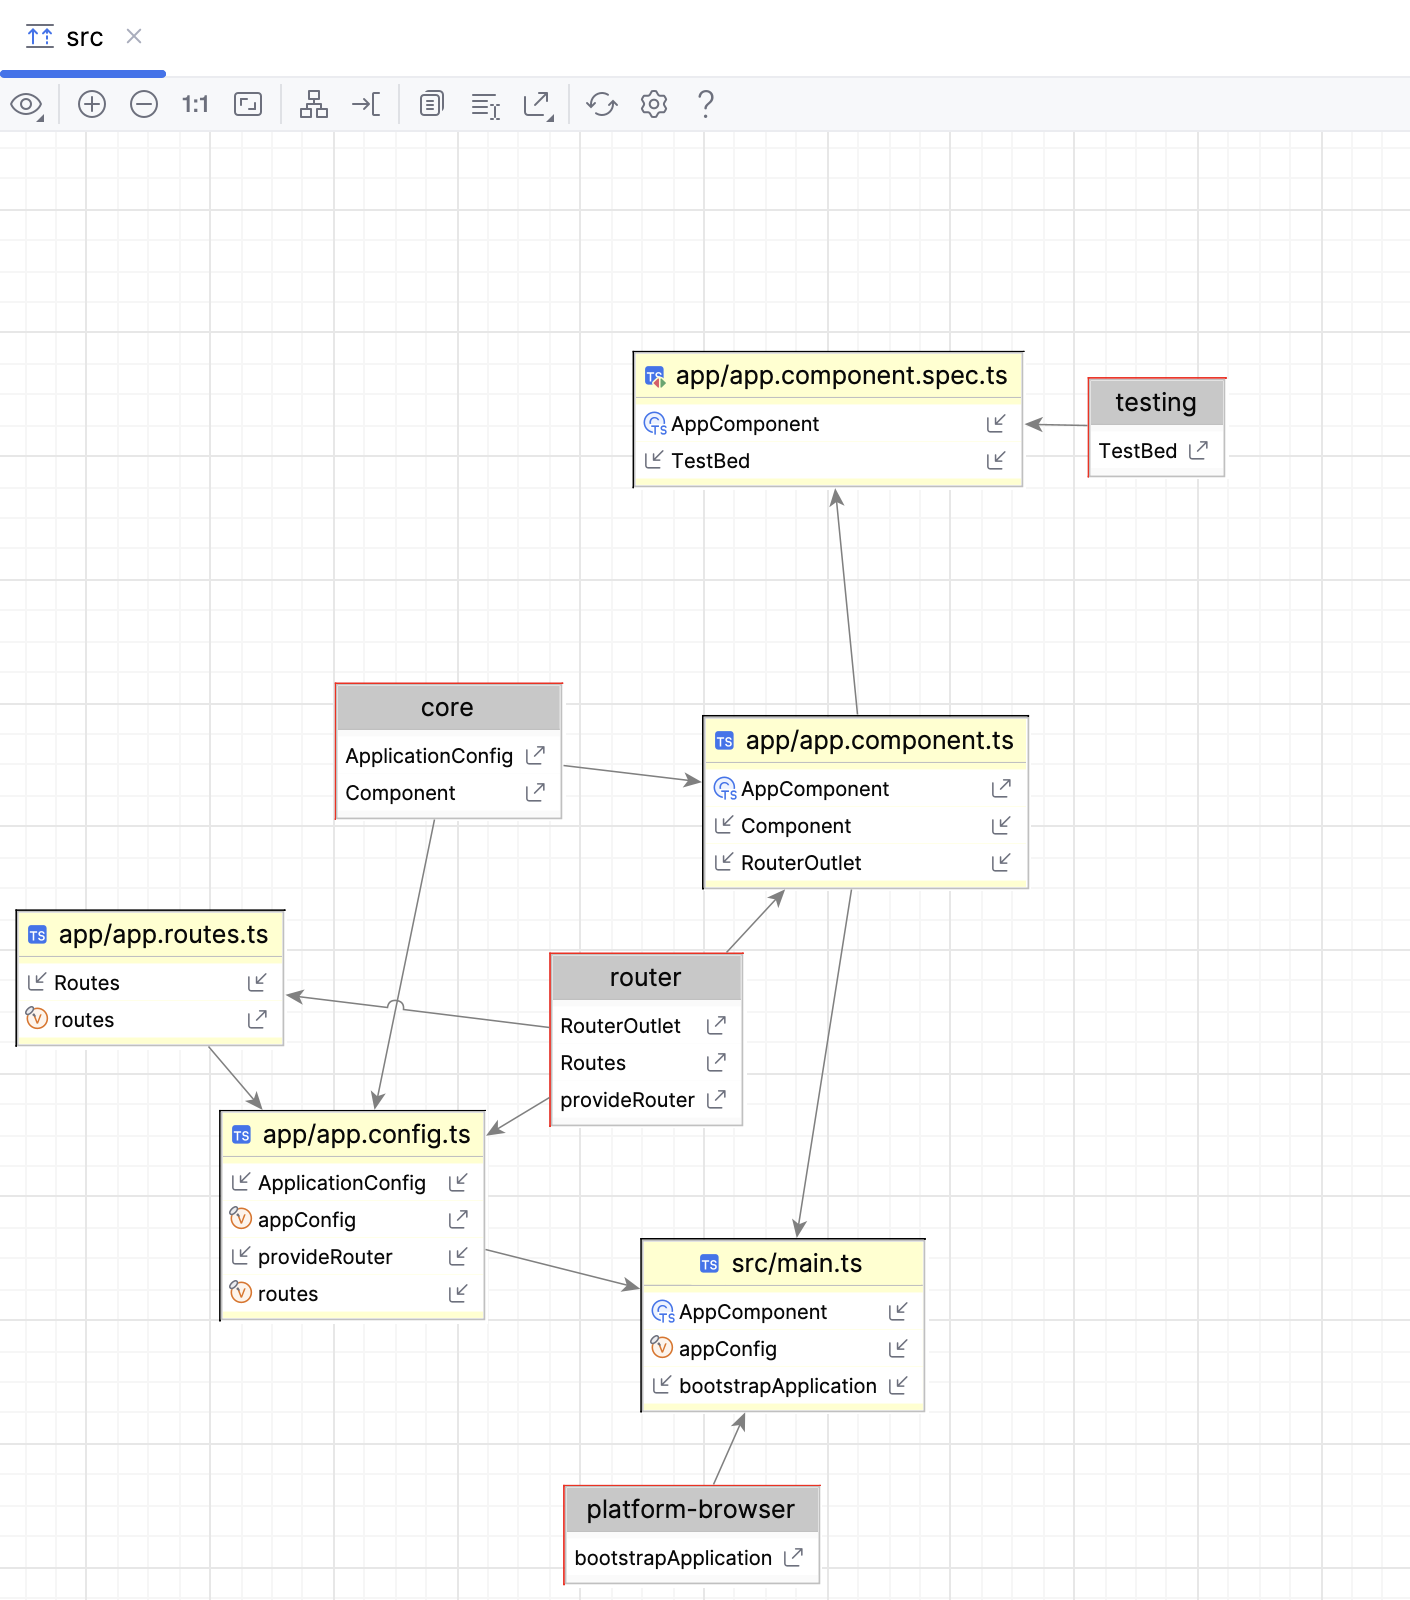
A diagram consists of a number of rectangles. Each of them shows the name of the analyzed selected file and a list of detected imports. If an import is resolved, an icon that indicates the type of the imported symbol (e.g.
 or
or  ) is shown next to it.
An arrow from an analyzed file points at the target file from which the detected imports are made. If the target file is a library, its name is displayed on the grey background. If an import from a library is not resolved, the target file is displayed as a grey rectangle with a red border.
Resolved imports and exports are marked with the
 or
or  icons respectively.
Analyze diagrams
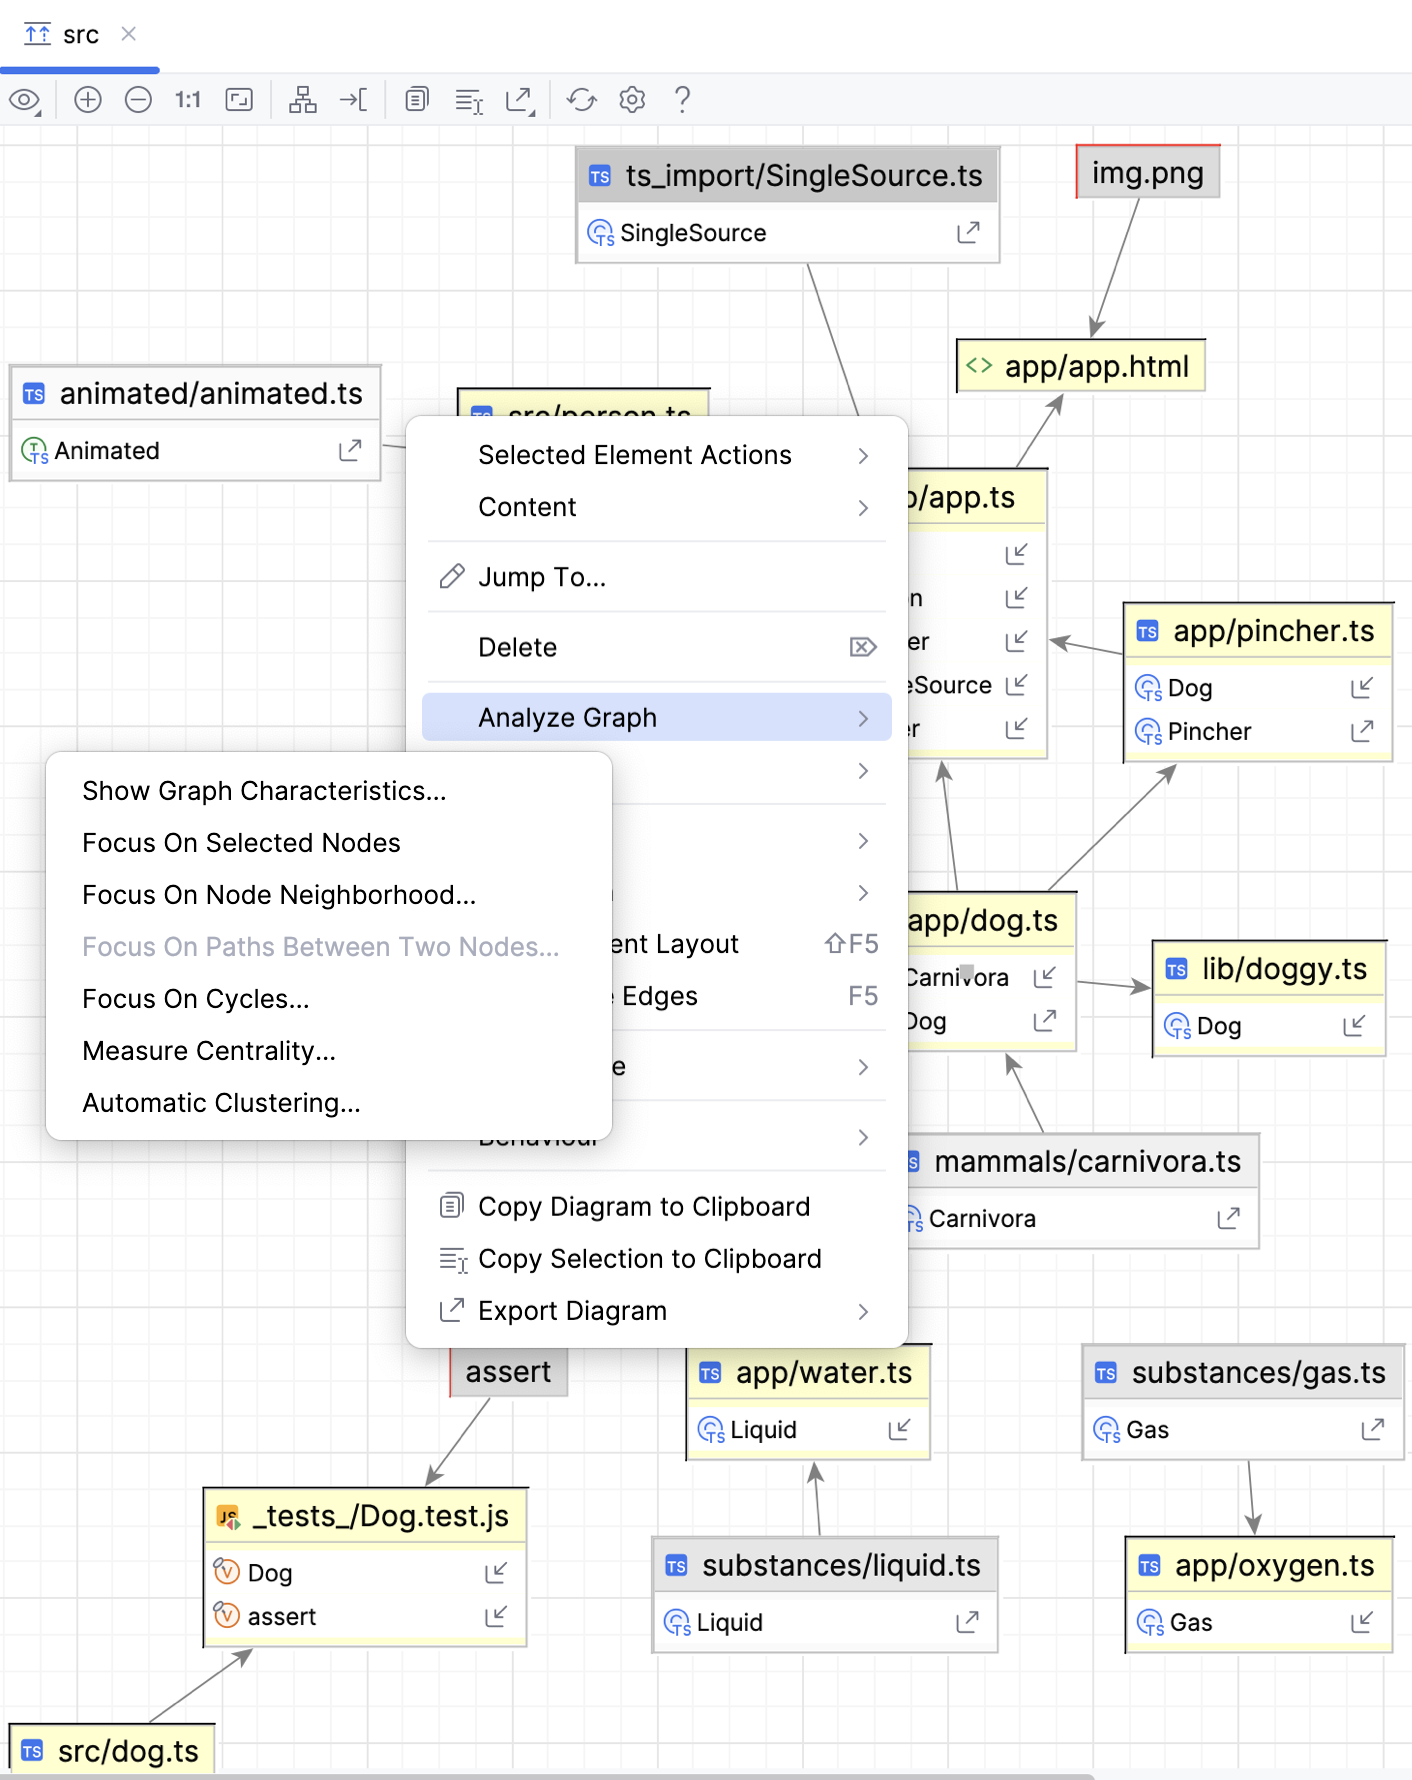
From the context menu of a diagram or a node, select and then select the required action.
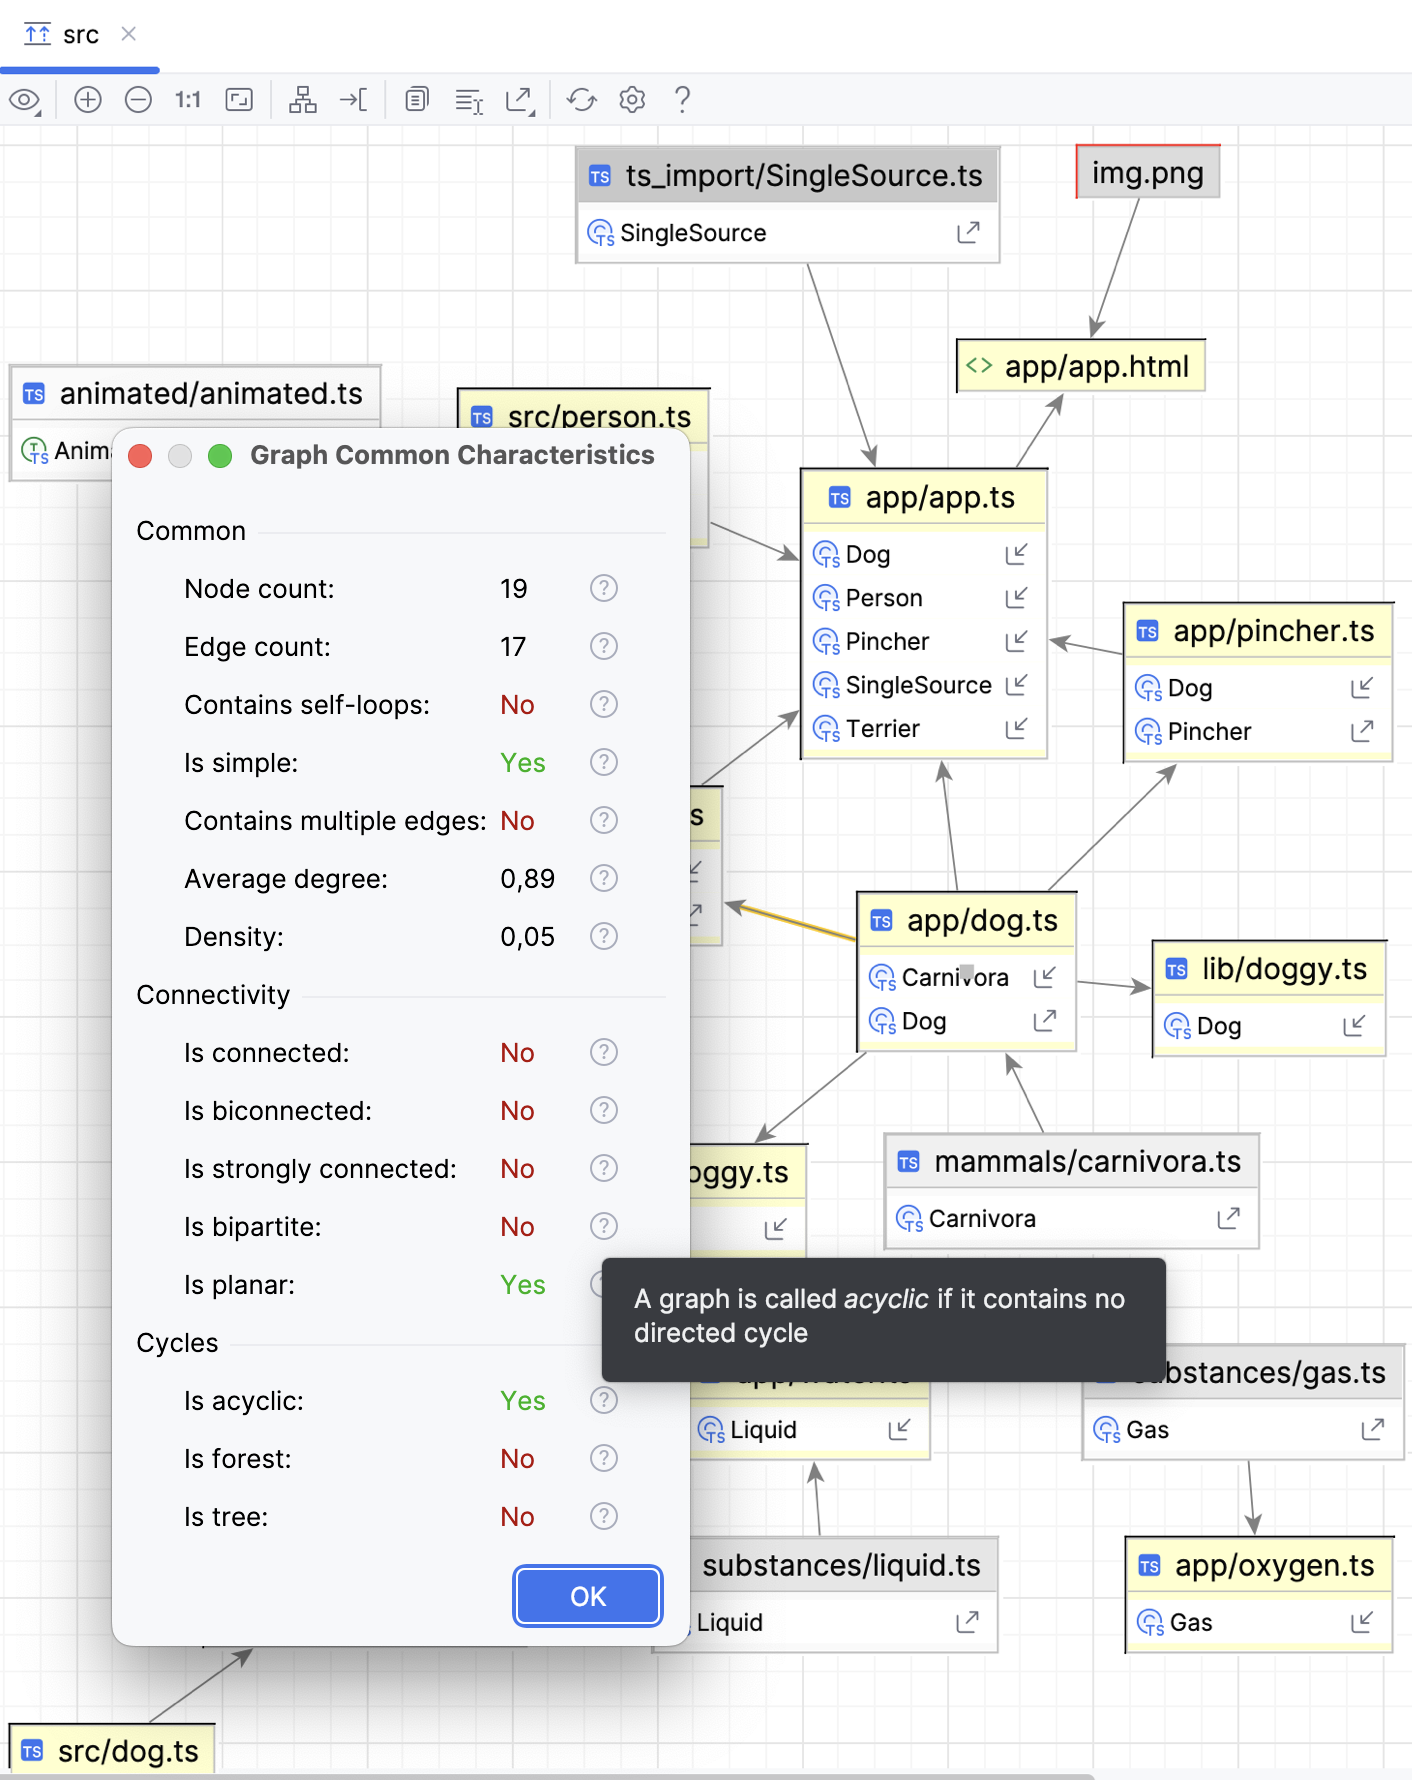
Show diagram characteristics
To get general information and statistics on a diagram, select from the context menu of the diagram.
To learn more about a specific metrics, click
 next to it.
Focus on selected nodes
To examine several nodes deeper, select them and then select from the context menu.
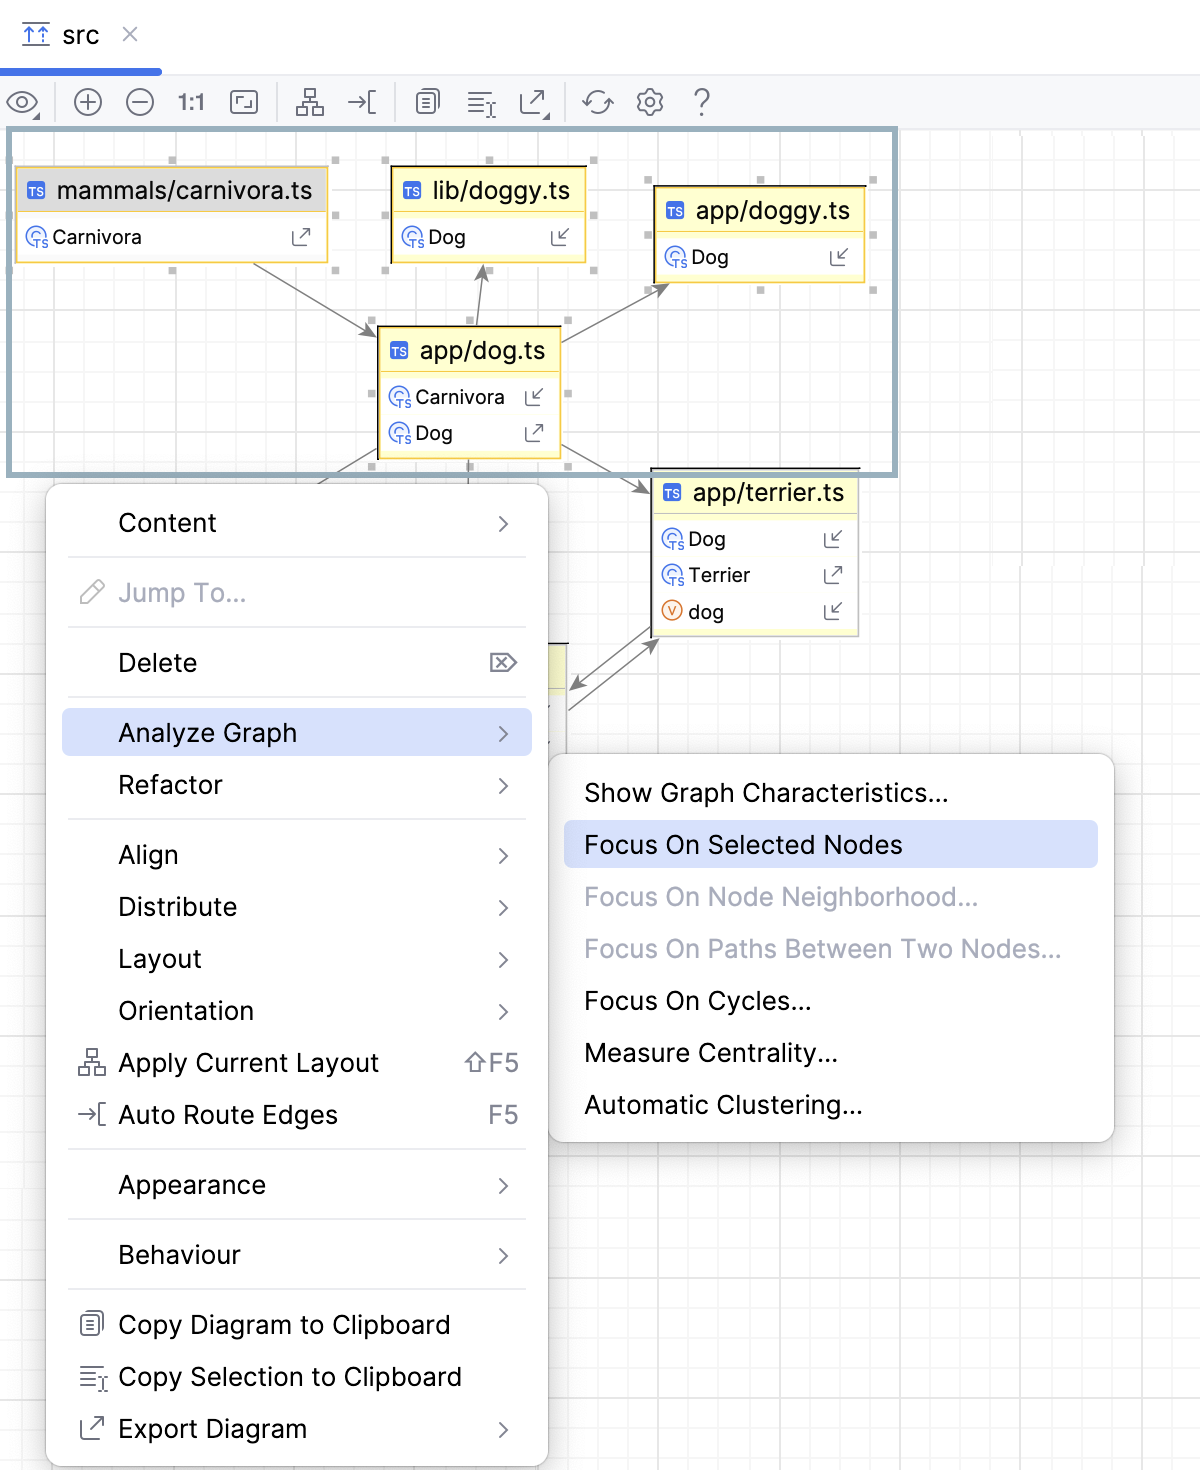
All the nodes except the currently selected ones are hidden.
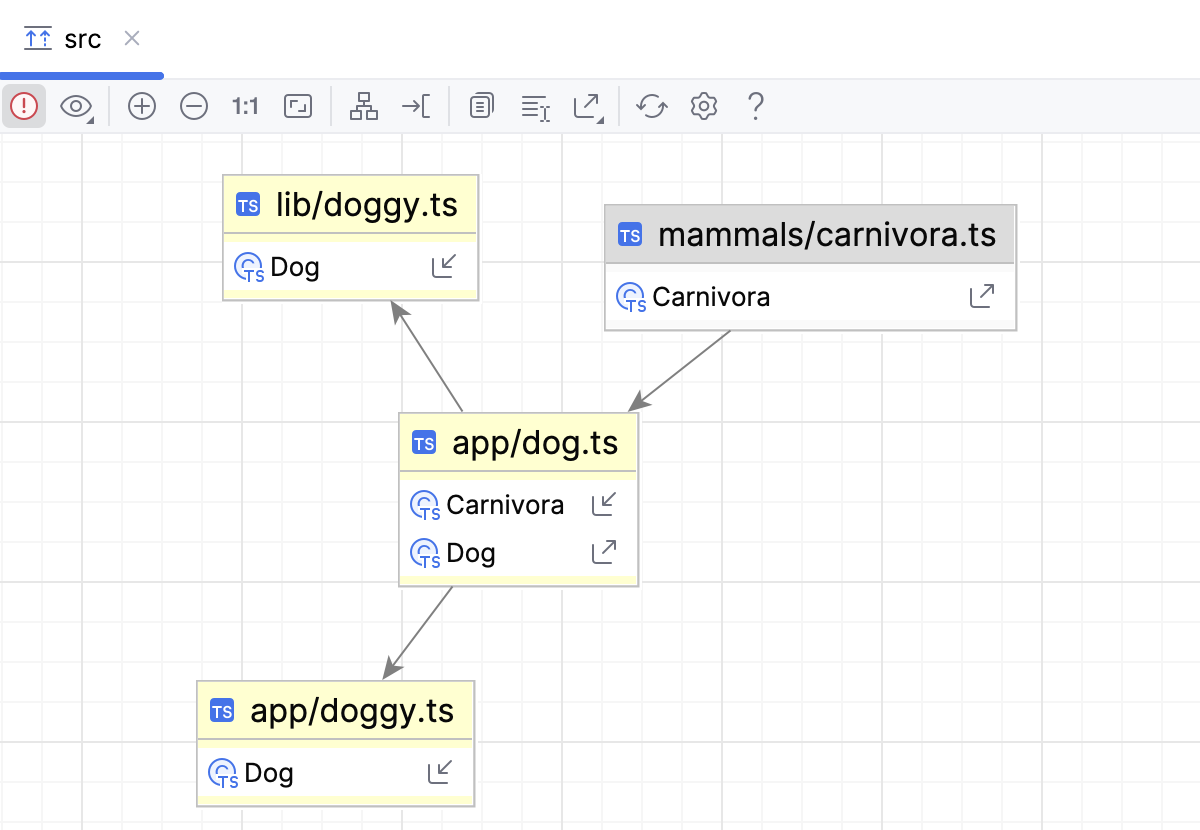
To restore the diagram, press Ctrl+Z.
Focus on node neighborhood
To examine one node deeper, select the required node and then select from its context menu.
In the Focus View On Node Neighborhood dialog that opens, specify the dependencies to show and click Find.
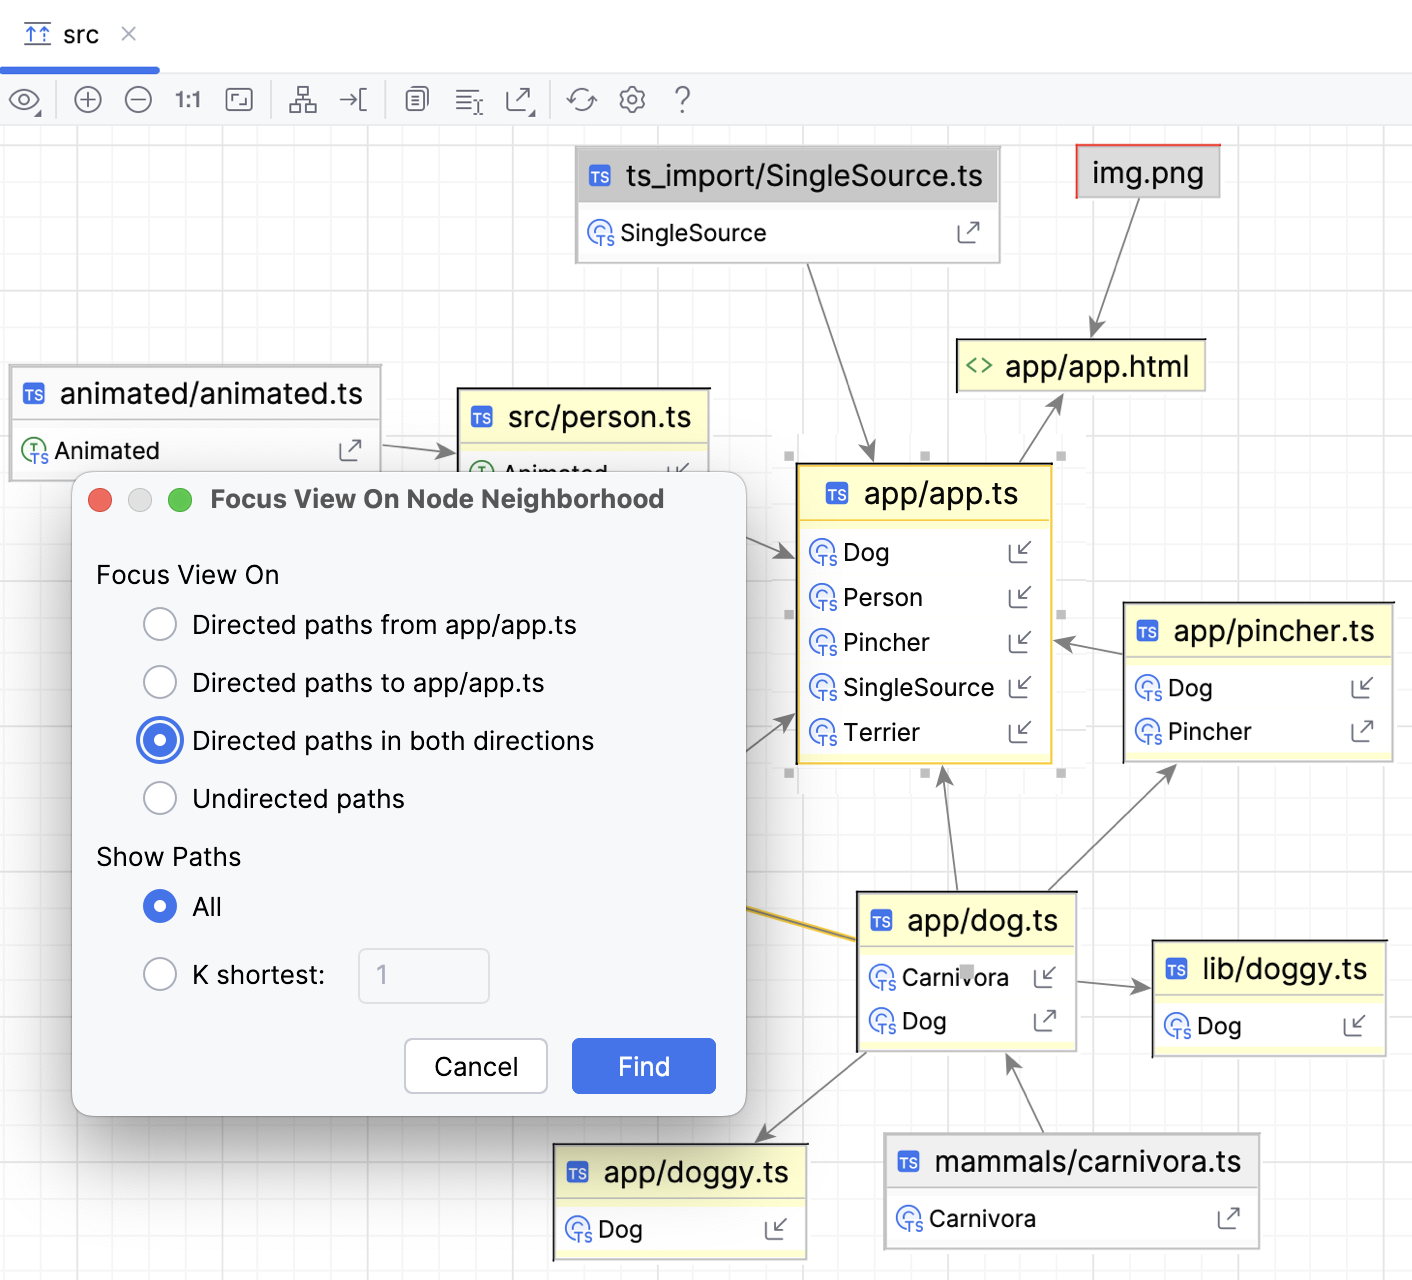
The selected node with its dependencies is shown.
Focus on paths between two nodes
Select the nodes the paths between which you want to examine and then select from the context menu.
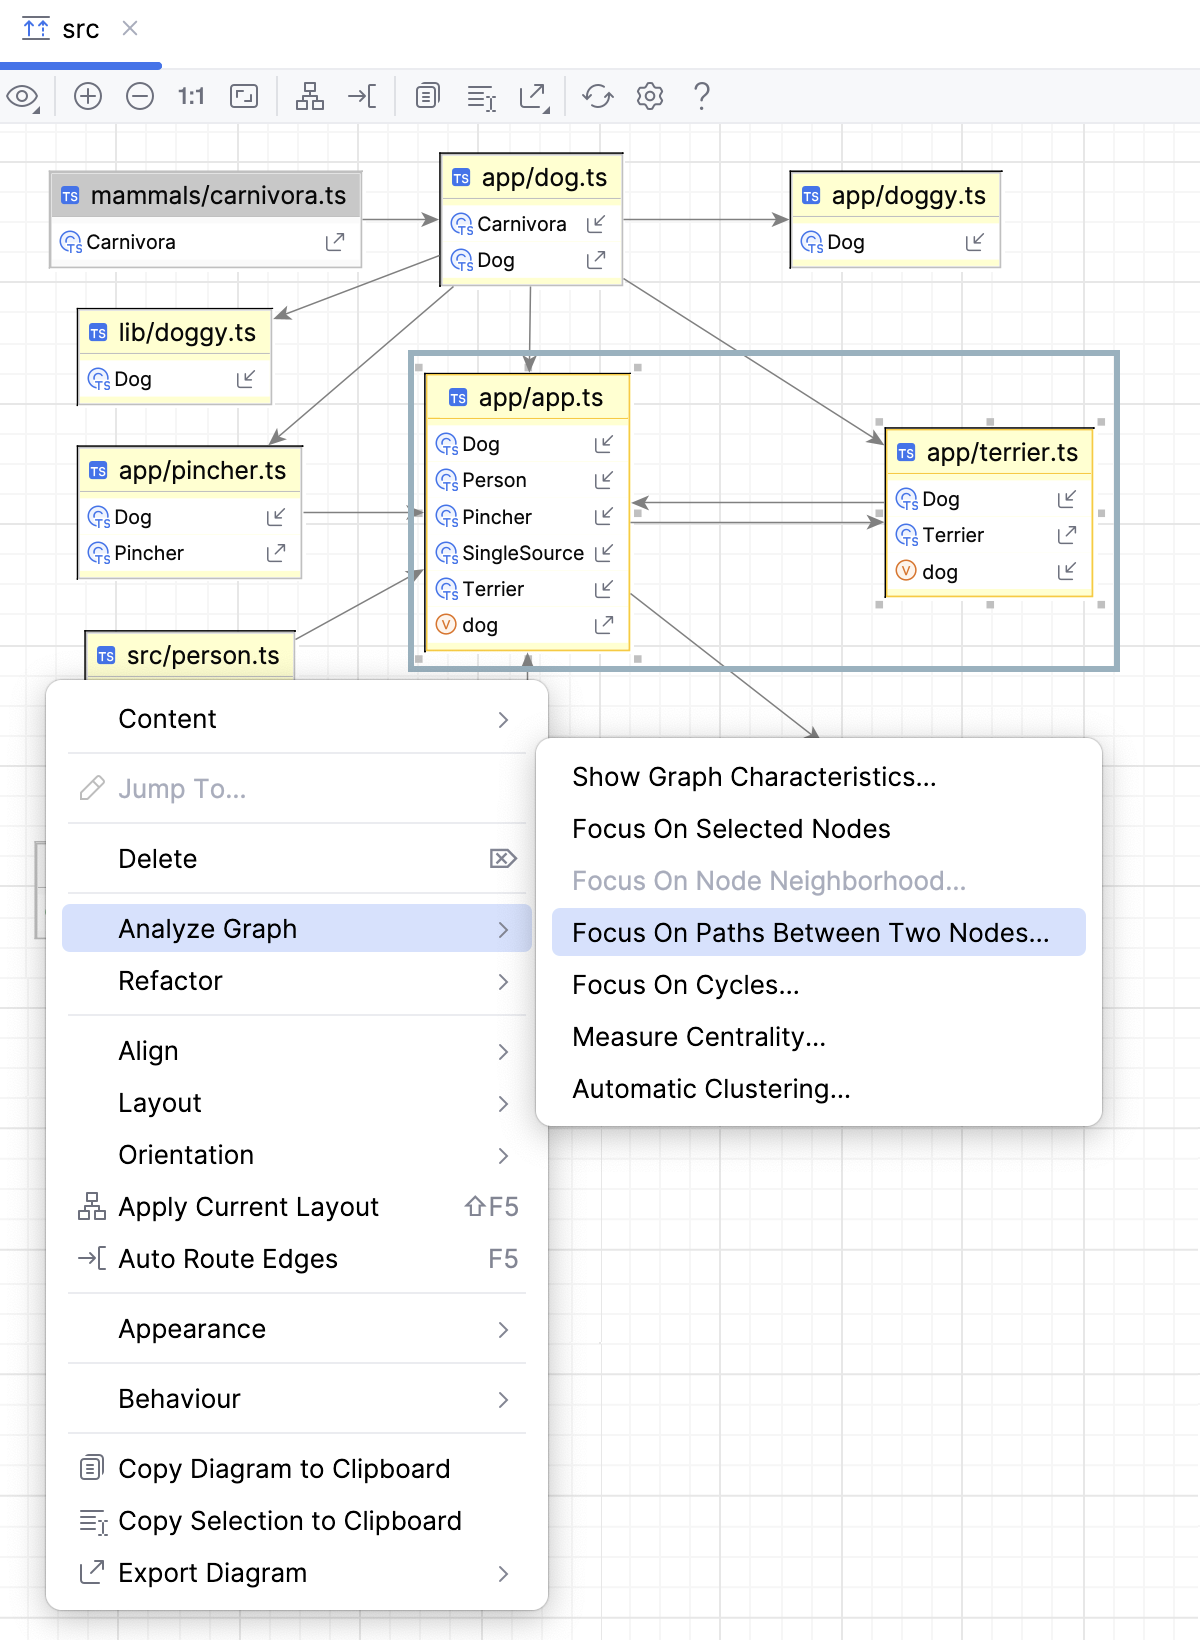
In the Focus On Paths Between Two Nodes dialog, configure the search and click Find.
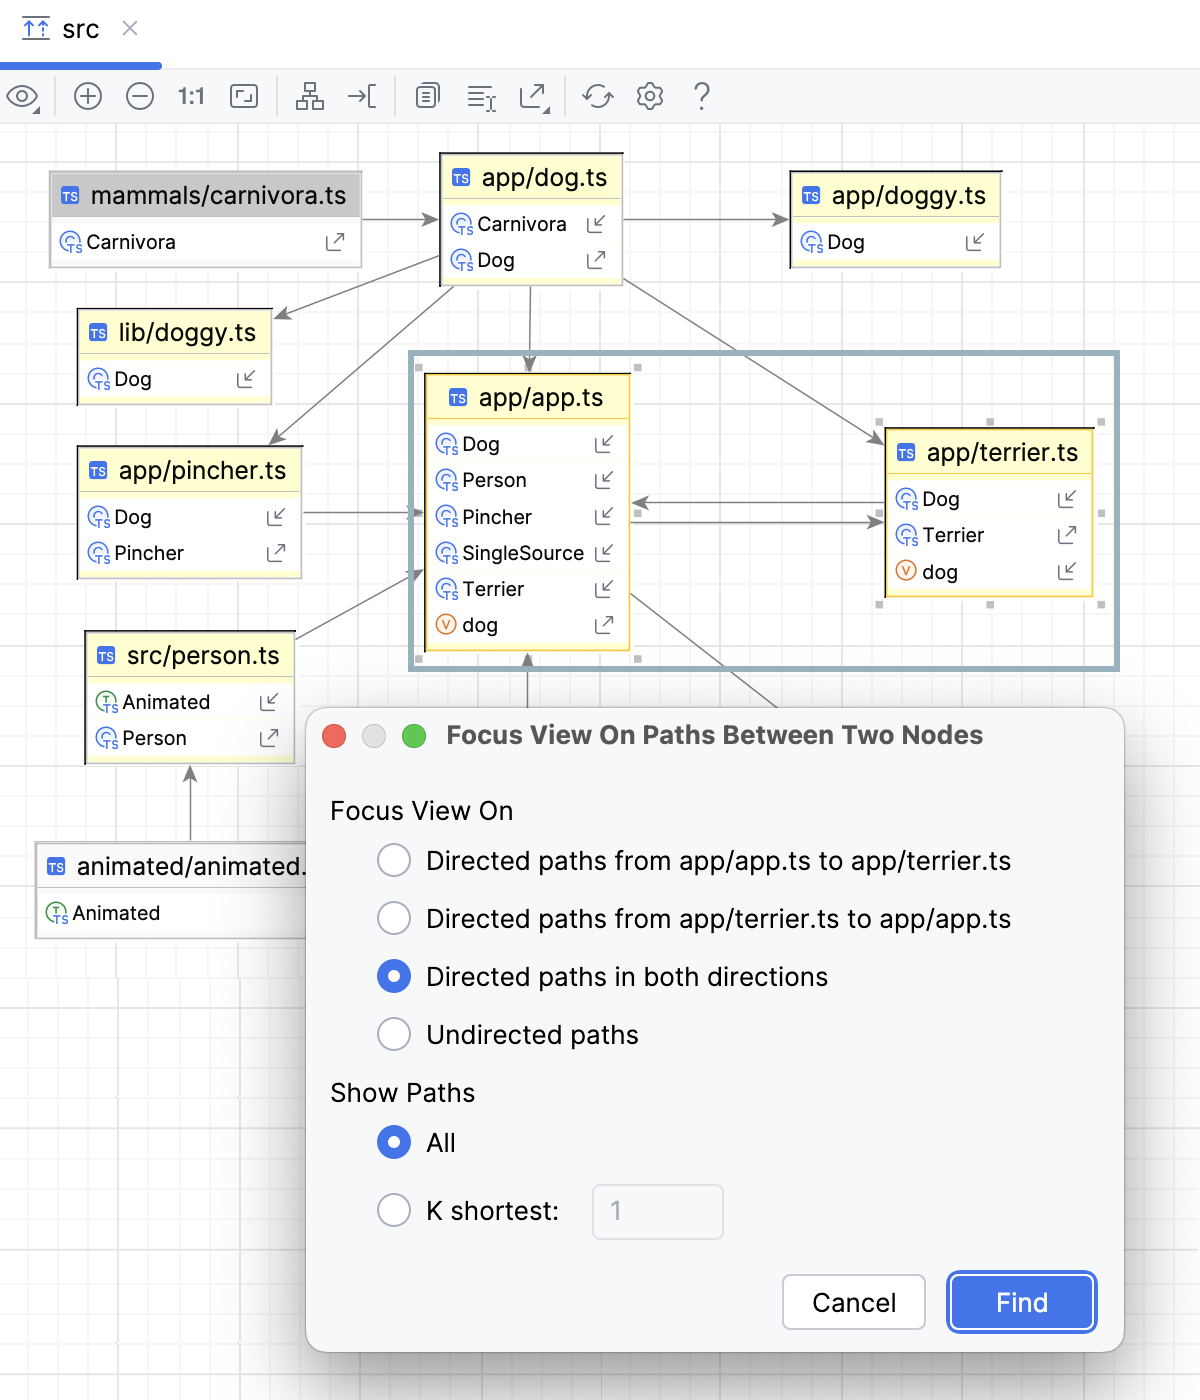
Focus on cycles
To view only cyclic dependencies, select from the context menu of the diagram.
In the Focus View On Cycles dialog that opens, specify the types of cycles to be shown and the scope for analysis.
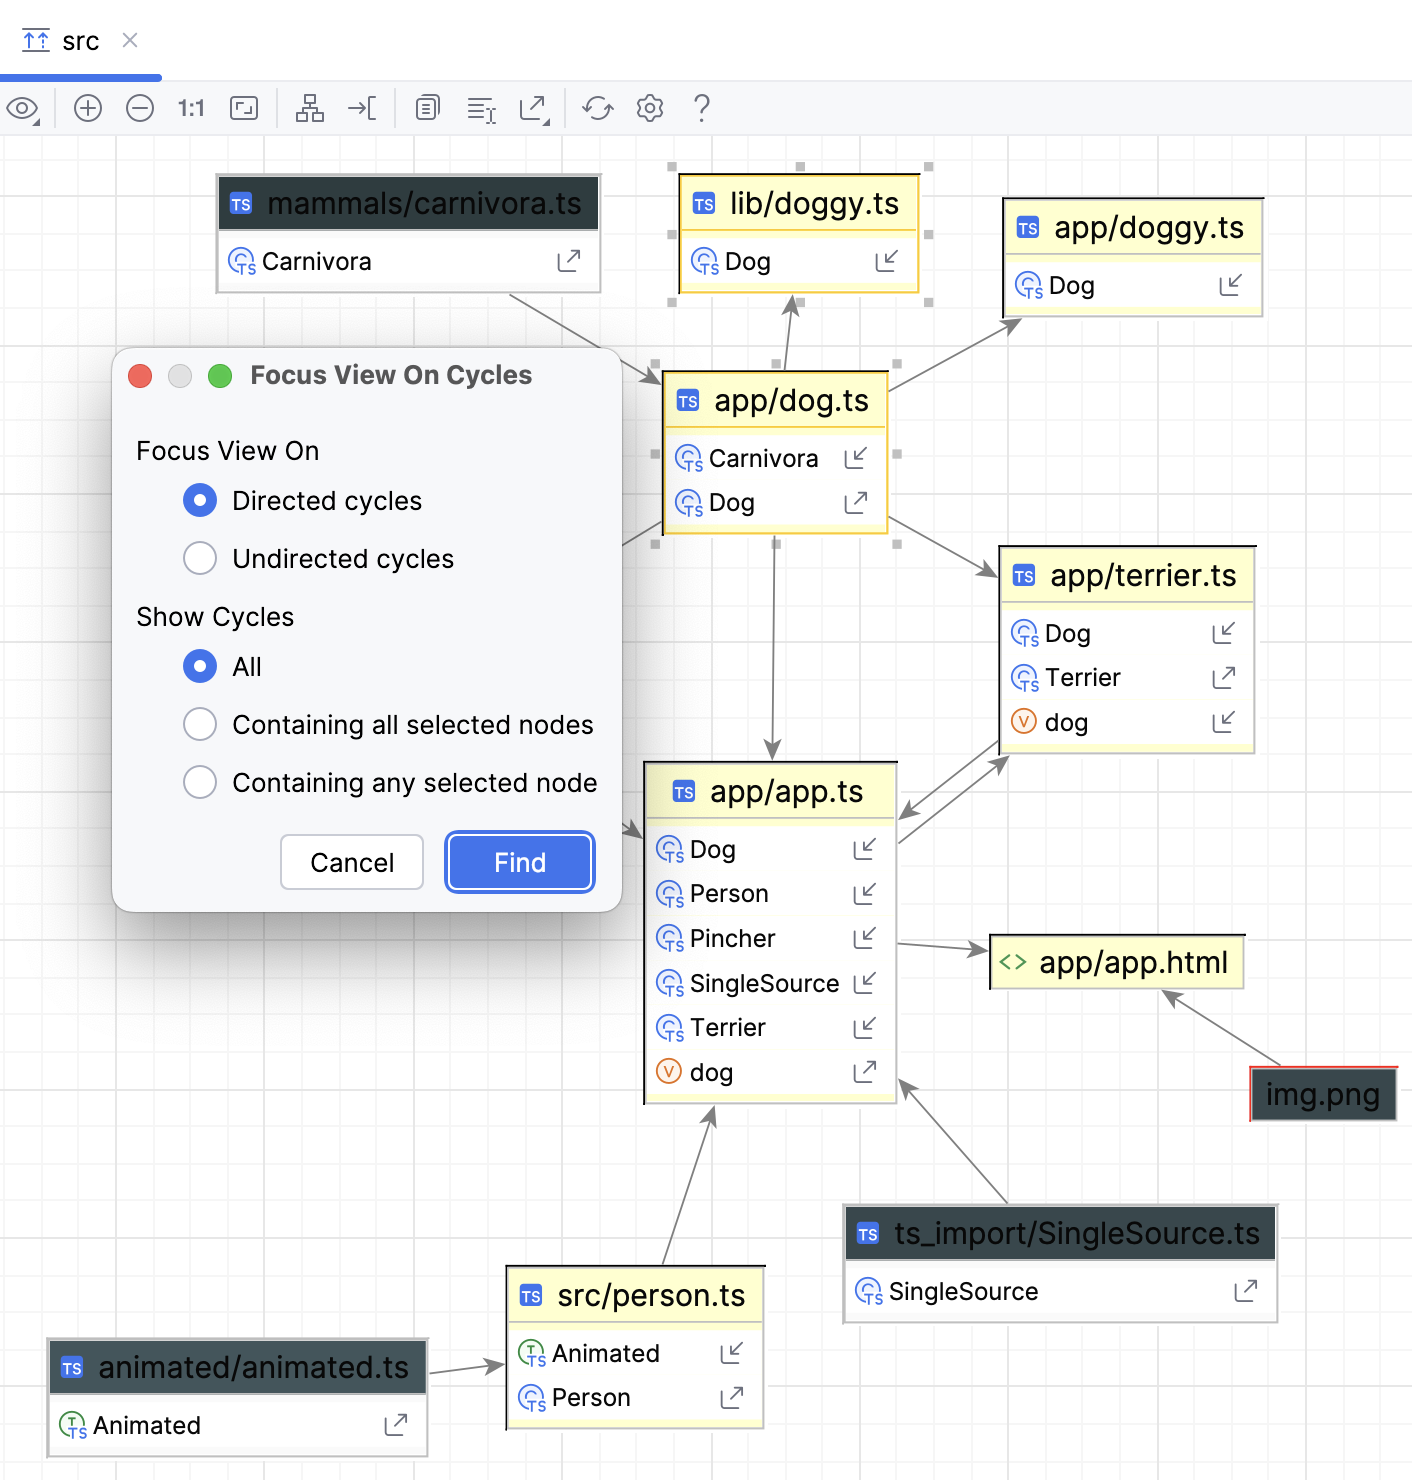
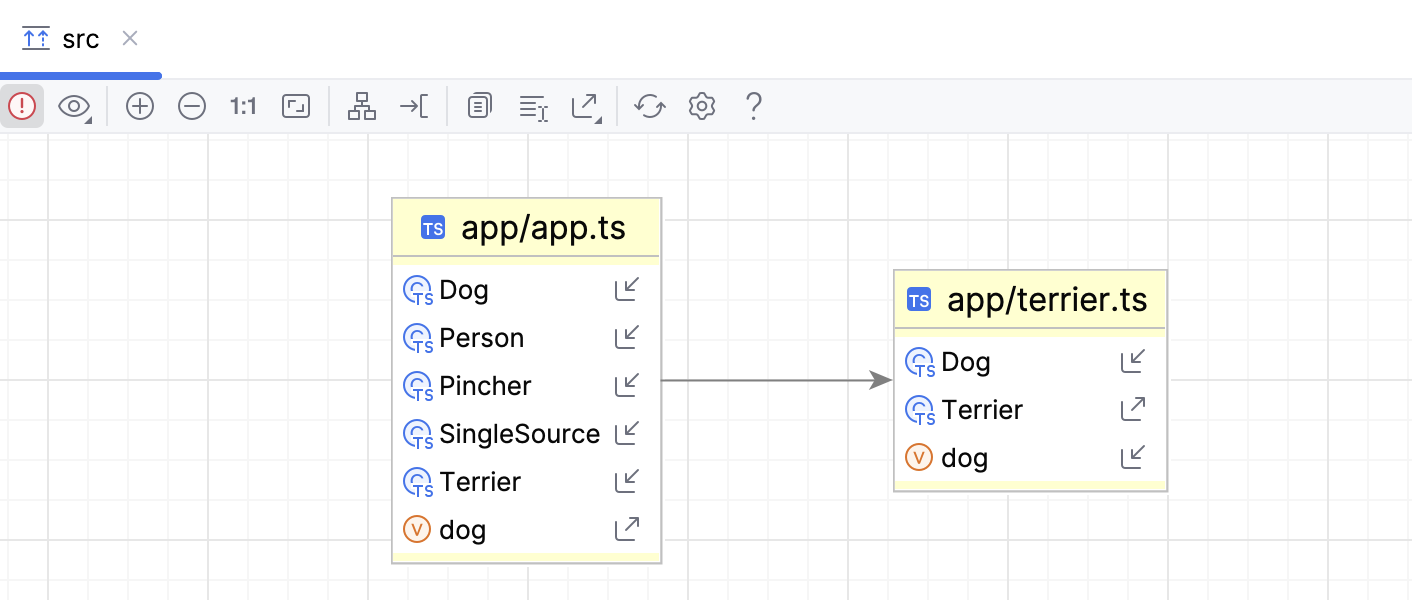
The diagram shows the modules from the specified scope that contain cyclic imports between each other.
Measure diagram centrality
Use this action to identify the important nodes in your diagram.
Select from the context menu of a diagram.
In the Measure Centrality dialog that opens, specify the key parameters to take into account and then click Measure.
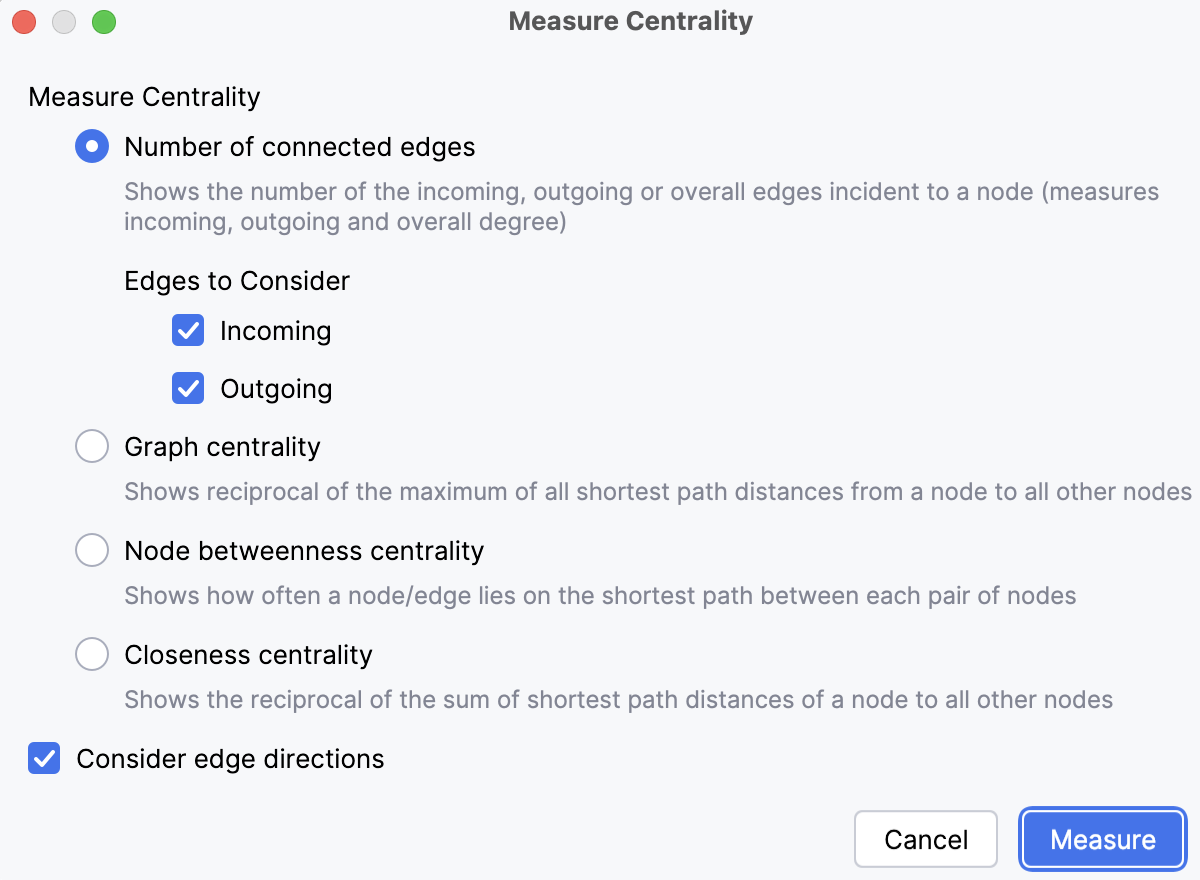
PhpStorm highlights nodes according to their calculated importance, so the most important nodes have the brightest selection. The importance of a node is expressed via fractional value from 0.0 to 1.0 measurement, which is displayed next to each node.
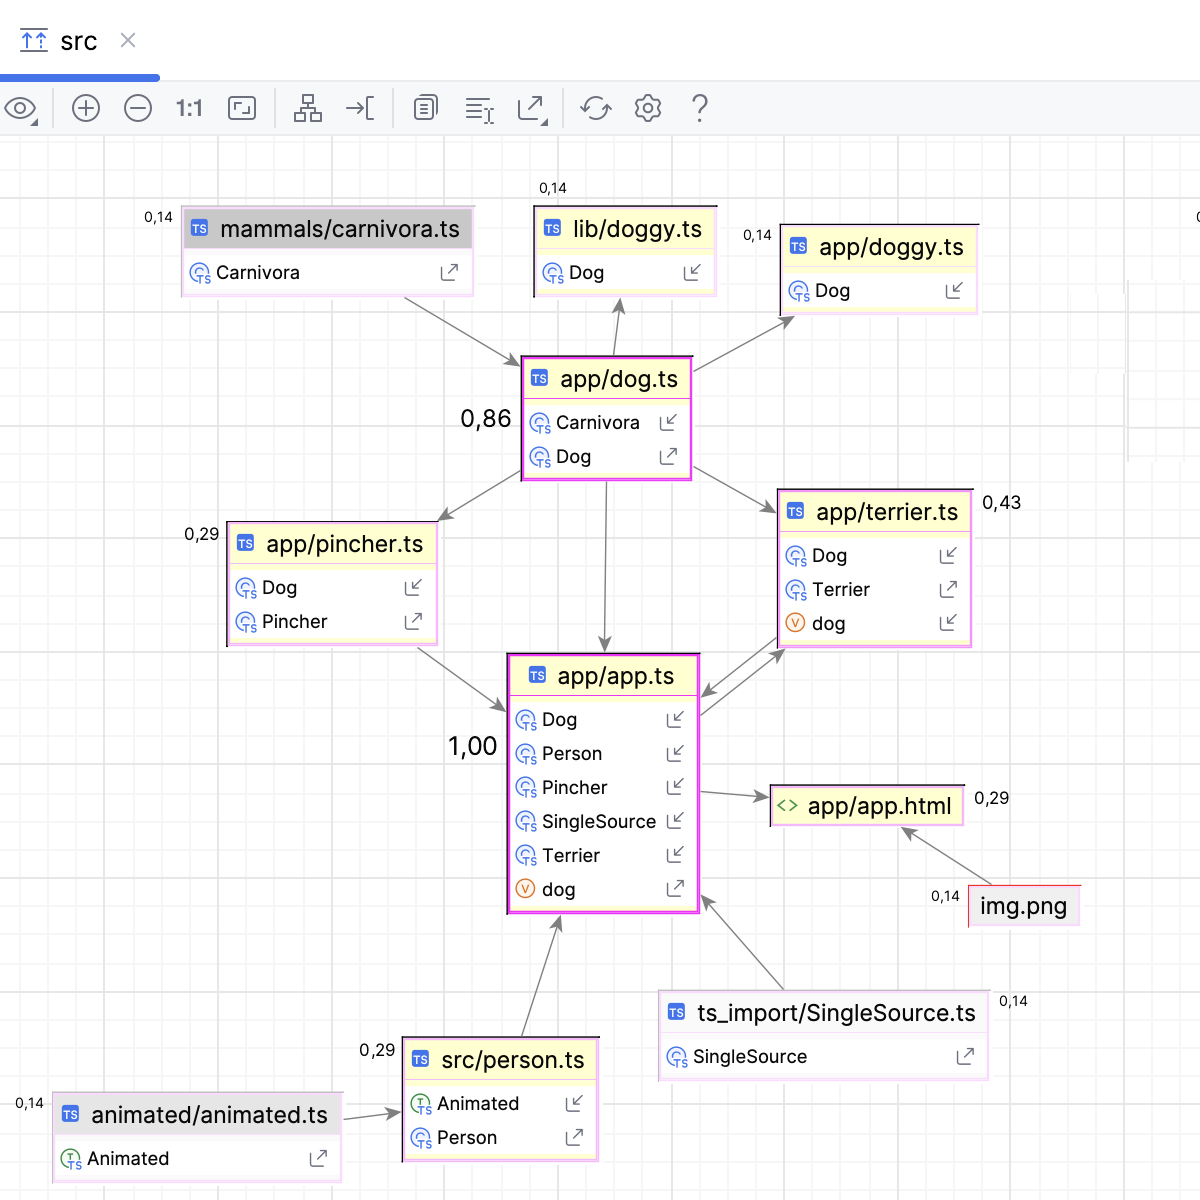
Group nodes into clusters
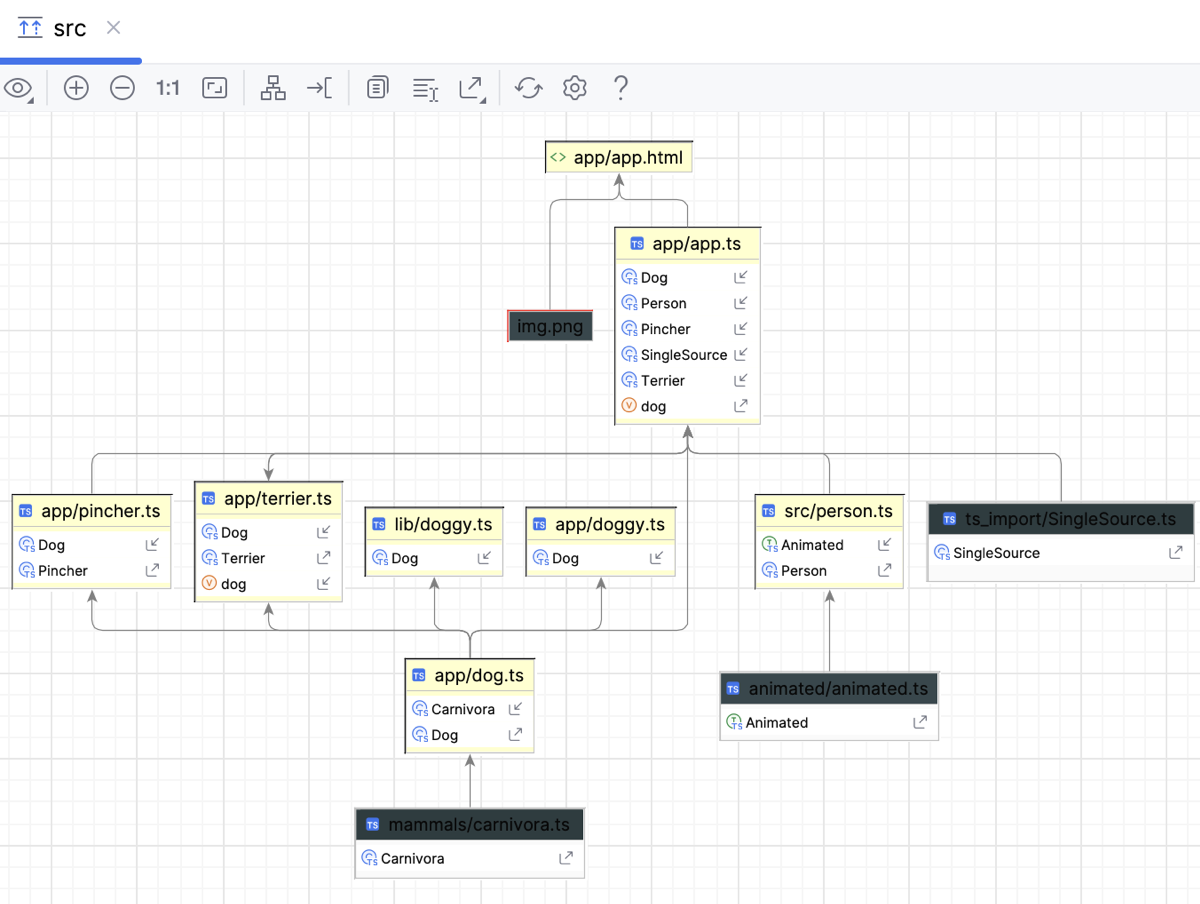
You can have the nodes in a graph grouped into clusters automatically based on the similarity of node edges, with modern methods designed to determine the optimal number of clusters.
Select from the context menu of a diagram.
In the Automatic Clustering dialog that opens, select the parameters to base clustering on and click Run.
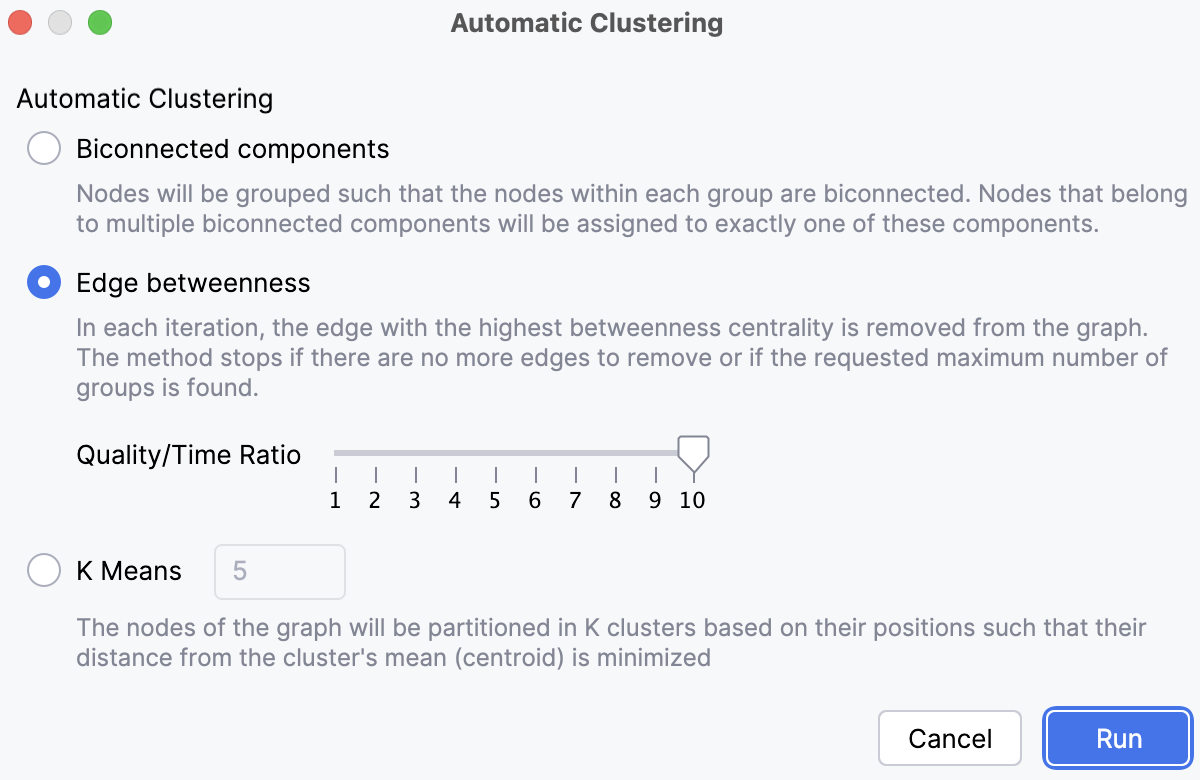
PhpStorm displays the generated clusters.
Navigating from the diagram to the source code
To jump from a diagram to a file, right-click the file in the diagram and choose from the context menu.
To navigate to a specific
importstatement in the source code, right-click the required file in the diagram, choose from the context menu, and then choose the symbol to jump to from the Select Navigation Target list: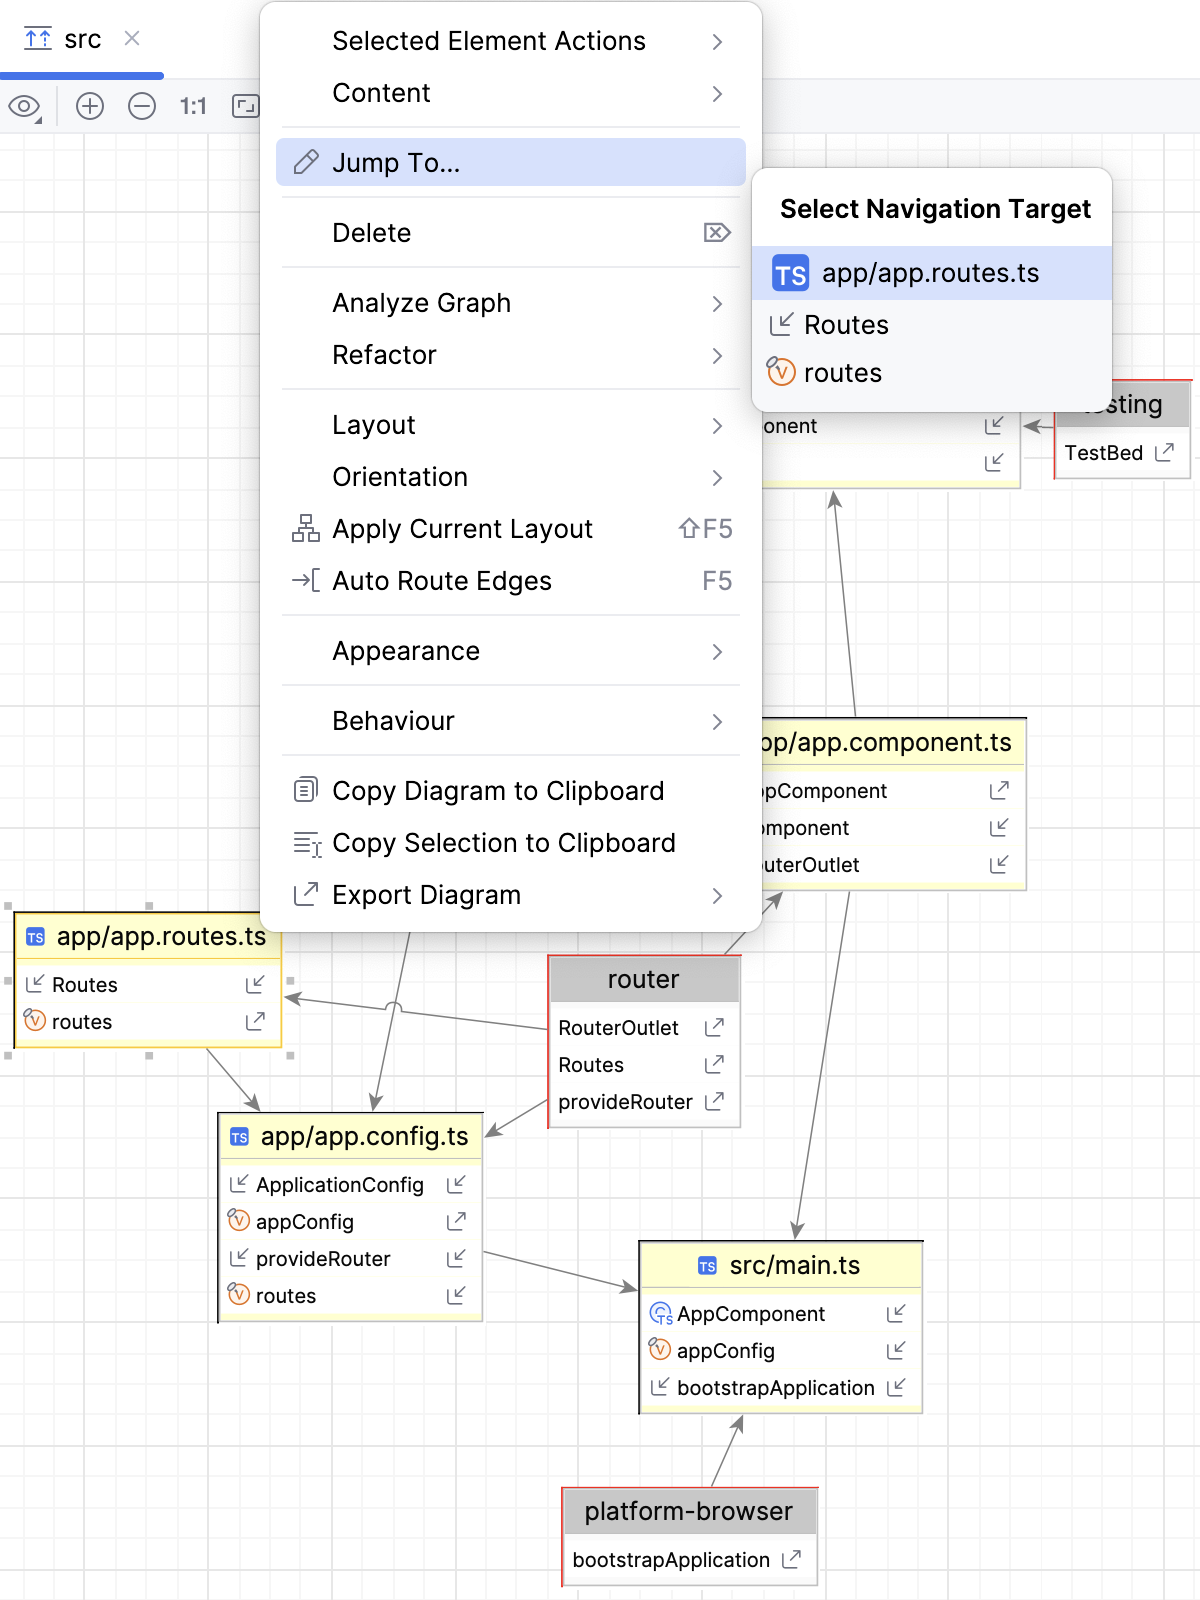
Context menu
Selected Element Actions
This menu item and the items under this node are shown when you have selected a node in the diagram.
Item | Description |
|---|---|
Copy | Copy the selection. |
Find Usages | Search for usages of the selection across the project. |
Show | View reference information on the selection, such as: |
Go to | |
Open In |
|
Search with Google | Open the browser and start searching for the file path of the selected item with Google. 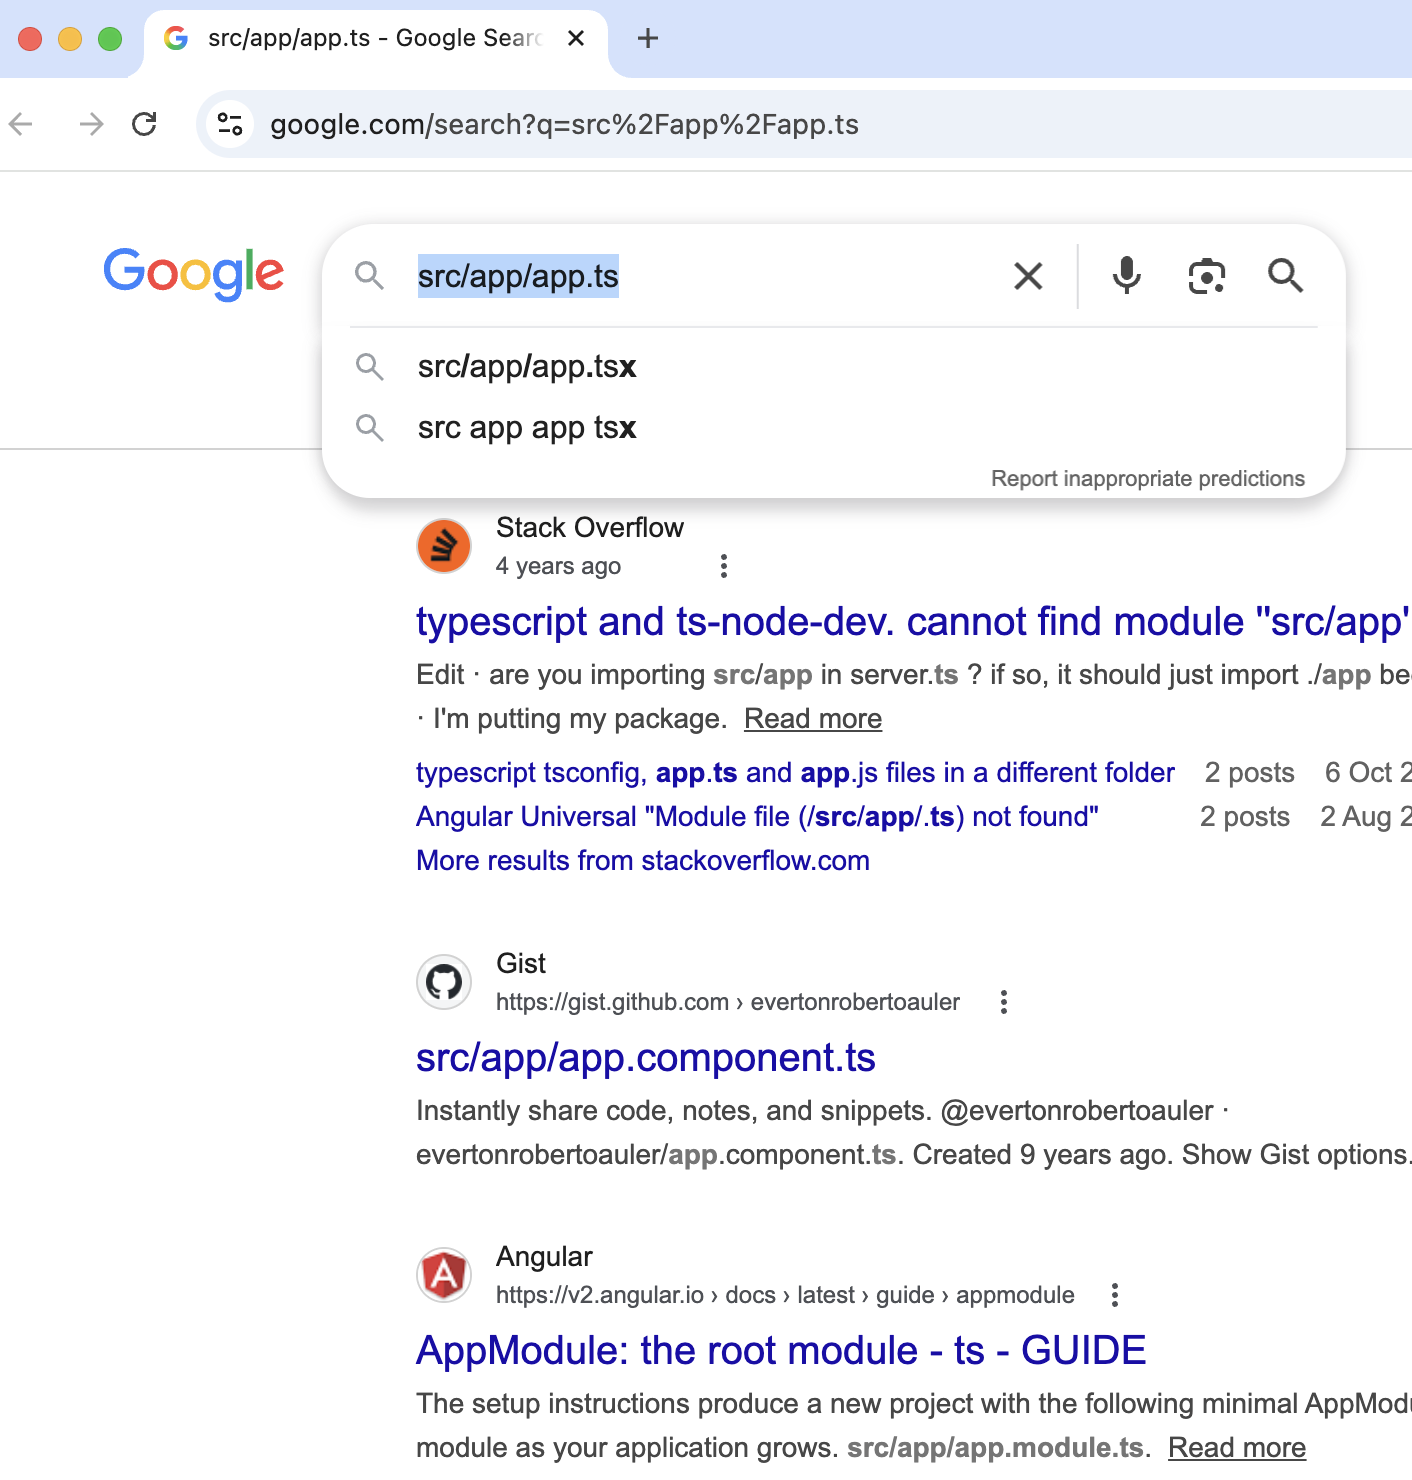 |
External Tools | Run an external tool against the selected item. |
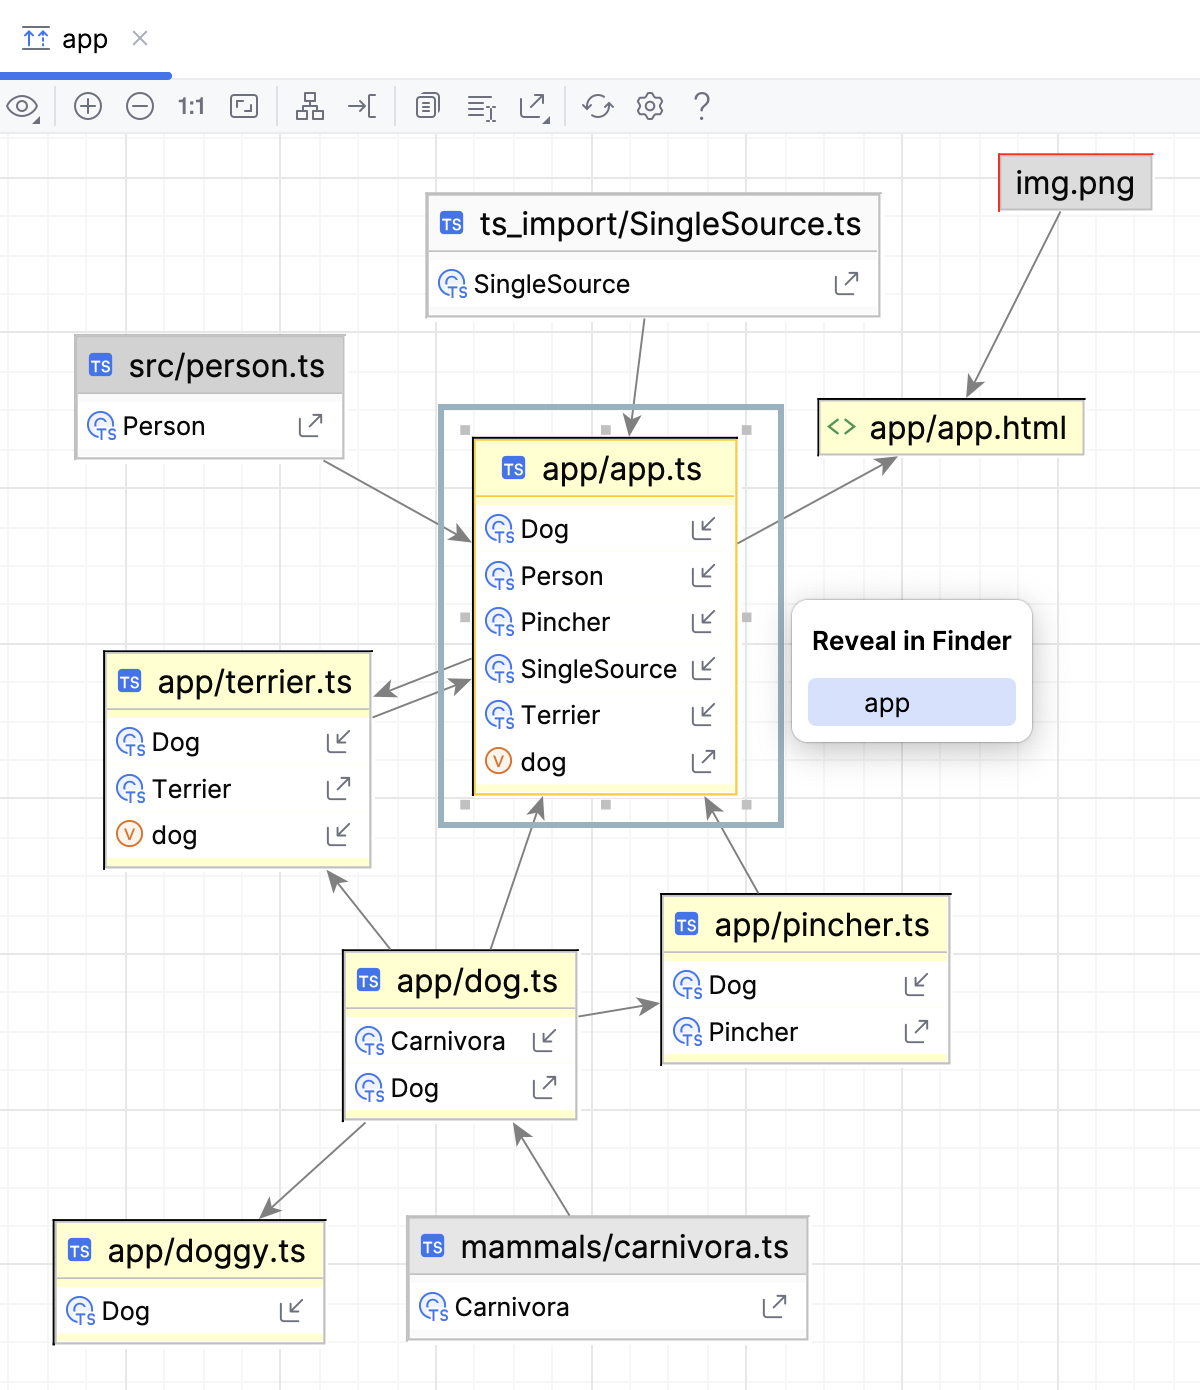
Content
Item | Description |
|---|---|
New | The item is only available when a node is selected in the diagram. Use this item to add the following types of notes to the current diagram.
|
Change Visibility Level | Select the level of details, the available options are:
Learn more from the yFiles official website. |
Jump To
The item is only available when a node is selected in the diagram. Use this item to open a popup list of files imports from which the selected item contains. Click a file in the popup to open it in the editor.
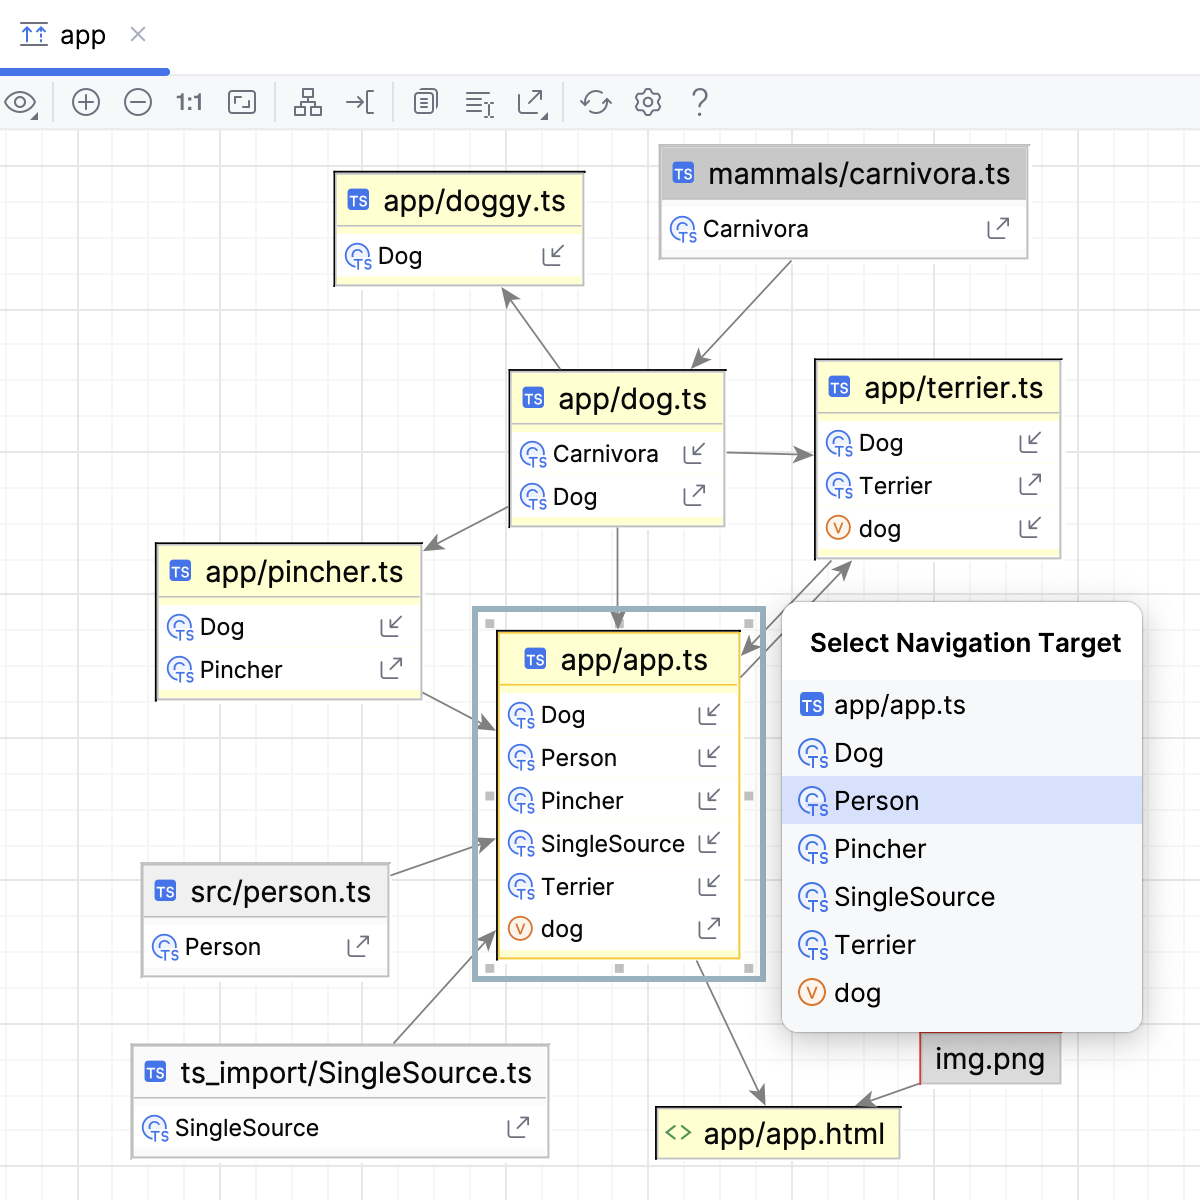
Delete
The action is only available when at least one node in the diagram is selected. Use the action to remove the selected node or nodes from the diagram.
Analyze Graph
Select this item to access the actions to examine the diagram as described above.
Refactor
The menu item is only available when a node is selected. Use the menu item to open a popup list with the refactorings that are available in the current context:
Layout
Select this menu item to open a popup list with available diagram layouts. Learn more from the yFiles official website.
Orientation
Select this item to open popup list where you can select the way to arrance the diagram visually on the screen.
Apply Current Layout
Select this menu item to apply the layout that is currenytly selected from the Layout list of the diagram context menu. The action is also available from the toolbar.
Auto Route Edges
Scale the contents of the diagram to the edges of the diagram window. The action is also available from the toolbar.
Appearance
Use this menu item configure the appearance of edges and labels, to specify whether to show grid or not, and so on. Learn more from the yFiles official website.
Behaviour
Use this menu item to open a popup list where you can enable or disable the following options:
Fit Content After Layout
After the automatic layout algorithm finishes arranging the graph, the viewport automatically zooms and pans so the entire diagram fits into view.
When the setting is enabled:, nodes and edges are rearranged by the layout algorithm. Then the canvas/view adjusts itself to show all content without manual zooming or scrolling.
When the setting is enabled:, the layout still runs, But the current zoom level and viewport position stay unchanged.
Show Structure View For Selected Node - enable this option to have PhpStorm automatically show the structure view of the file that corresponds to the currently selected node.
Copy Diagram to Clipboard
The action is also available from the toolbar.
Copy Selection to Clipboard
Choose this menu item and then select any diagram area – the selected area will be copied into the clipboard. The action is also available from the toolbar.
Export Diagram
Export the diagram using various formats, which are compatible with third-party tools, to a file, to an image, or open the diagram in the browser.
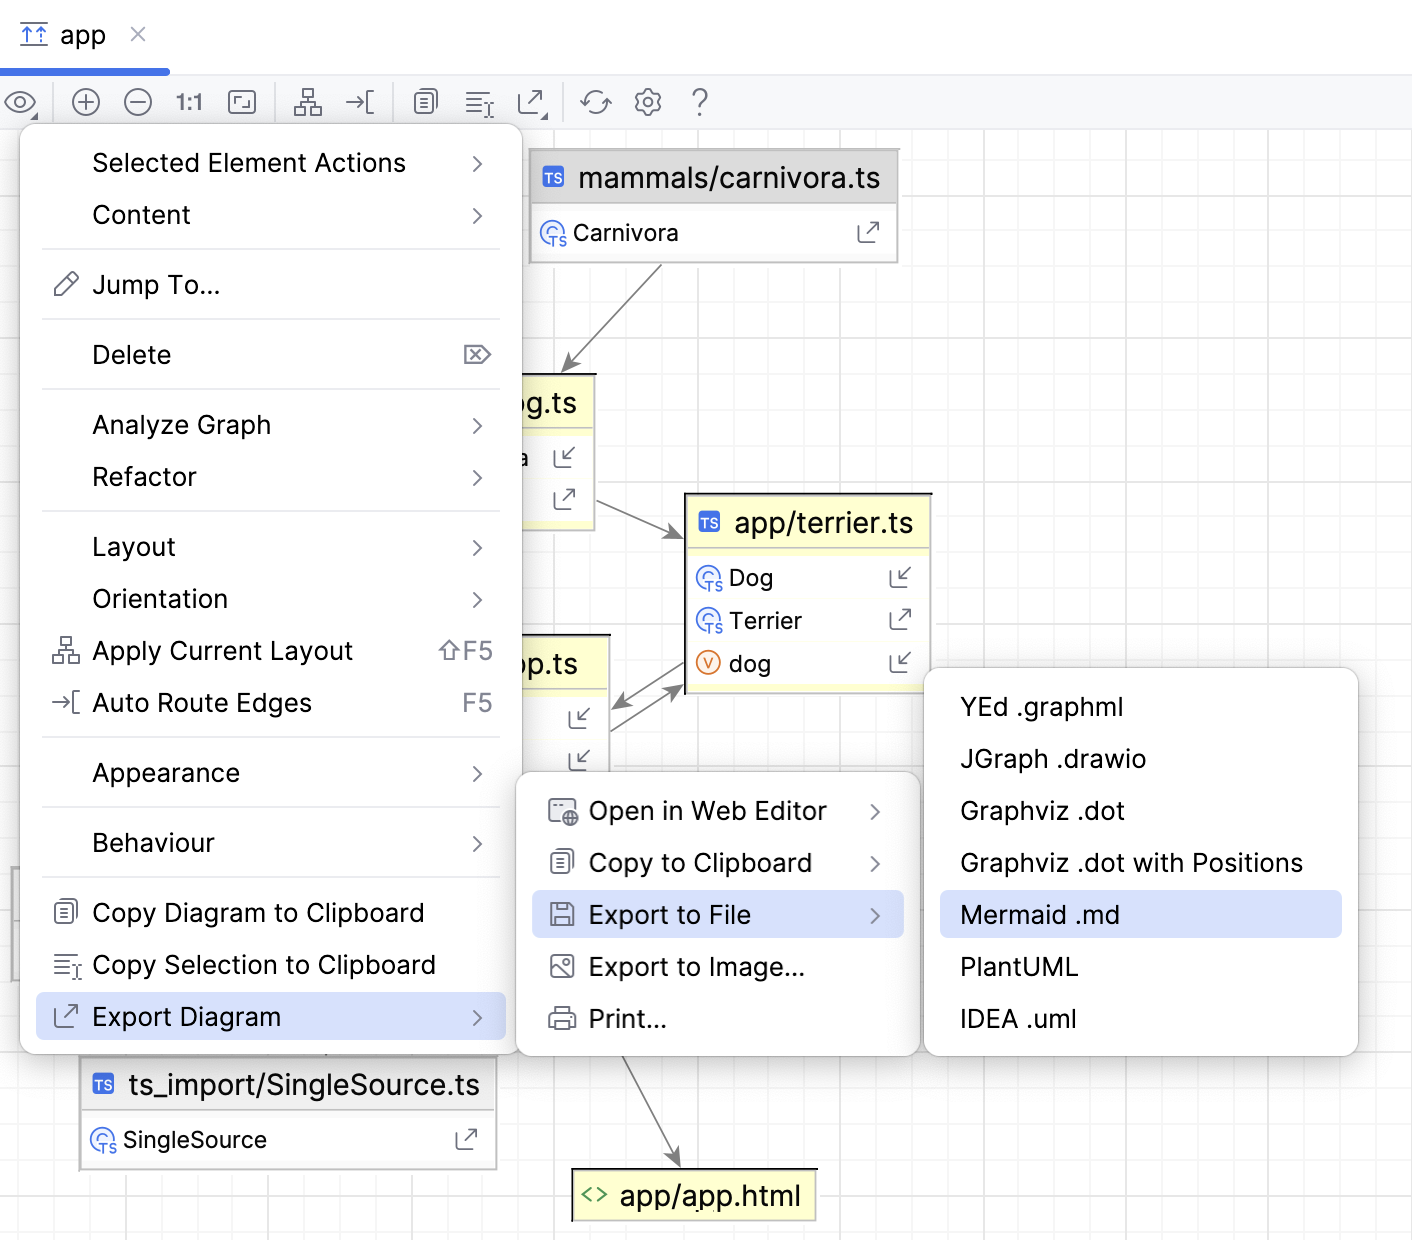
You can select and configure the following options:
 : click this button to select a third-party editor to which you can export the diagram.
 : click this button to save the diagram to a clipboard using one of the available formats.
 : click this button to save the current diagram as a file. You can use one of the available formats from the list.
 : click this button to save the current diagram in the PNG format.
 : click this button to print the diagram.
The action is also available from the toolbar.
Toolbar
Item | Description |
|---|---|
| Click this icon to select the level of details, the available options are:
Learn more from the yFiles official website. |
| Zoom the diagram in / Zoom the diagram out |
| Click this icon to restore the original size of the diagram, as it was befor zooming in or zooming out. |
| Click this icon to make the contents fit into the current diagram size. |
| Click this icon to apply the layout that is currenytly selected from the Layout list of the diagram context menu. |
| Click this icon to scale the contents of the diagram to the edges of the diagram window. |
| Click this icon to copy the diagram into the clipboard. |
| Click this icon and then select any diagram area – the selected area will be copied into the clipboard. |
| Click this icon to export a diagram using various formats, which are compatible with third-party tools, to a file, to an image, or open the diagram in the browser. 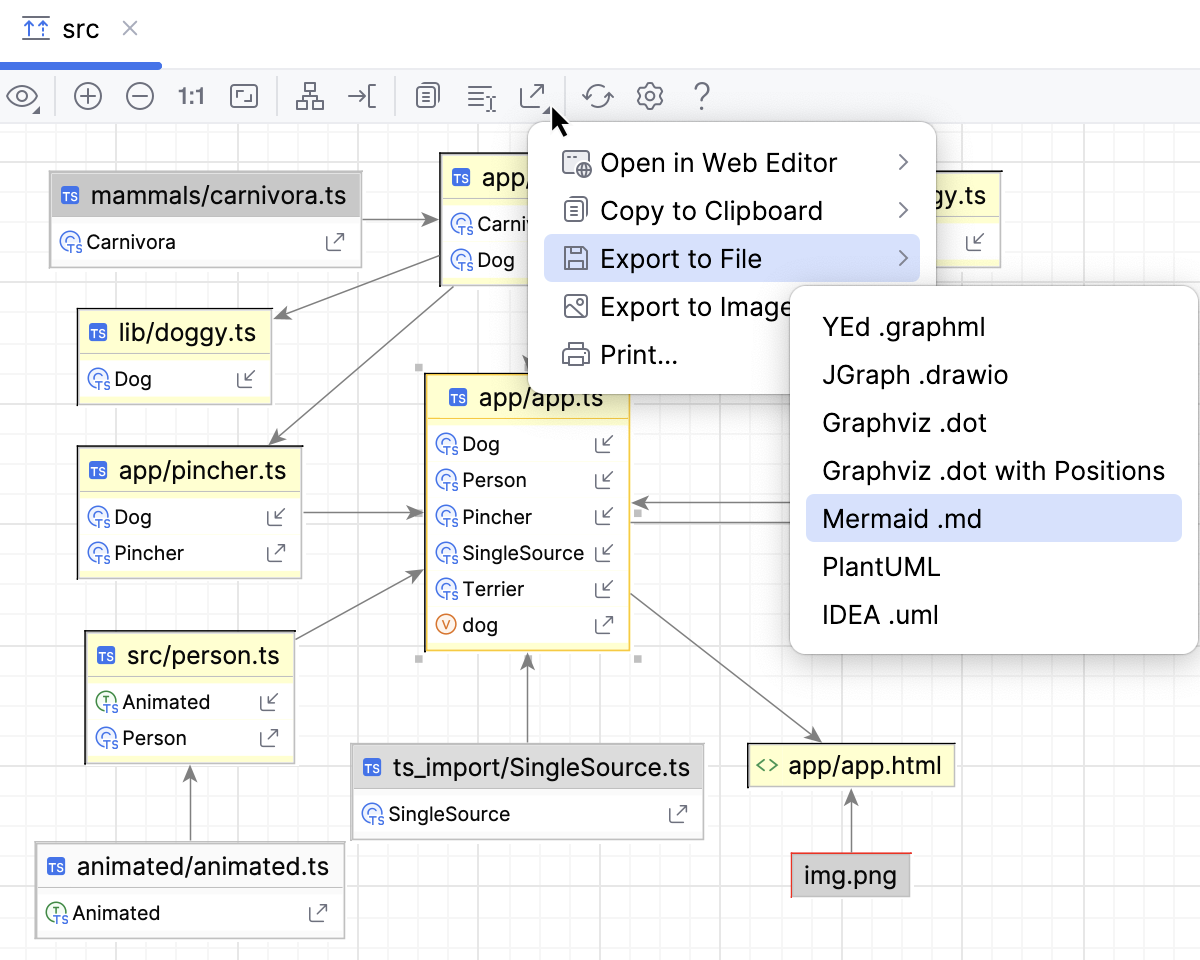 You can select and configure the following options:
|
| Click this button to refresh the whole diagram. |
| Click this button to open the Diagram settings where you can configure additional options. |

 /
/


