Debug with PHP exception breakpoints
With PHP exception breakpoints, the debugger suspends execution of the application code when an exception or an error is thrown or when a PHP notice or warning is emitted.
Unlike line breakepoints, which you have to set to specific lines in the source code, the configured exception breakpoints apply globally across the codebase. When an exception breakpoint is hit, PhpStorm adds the ![]() icon to the respective line of code automatically.
icon to the respective line of code automatically.

Set up PHP exception breakpoints
Press Ctrl+Shift+F8 or select from the main menu.
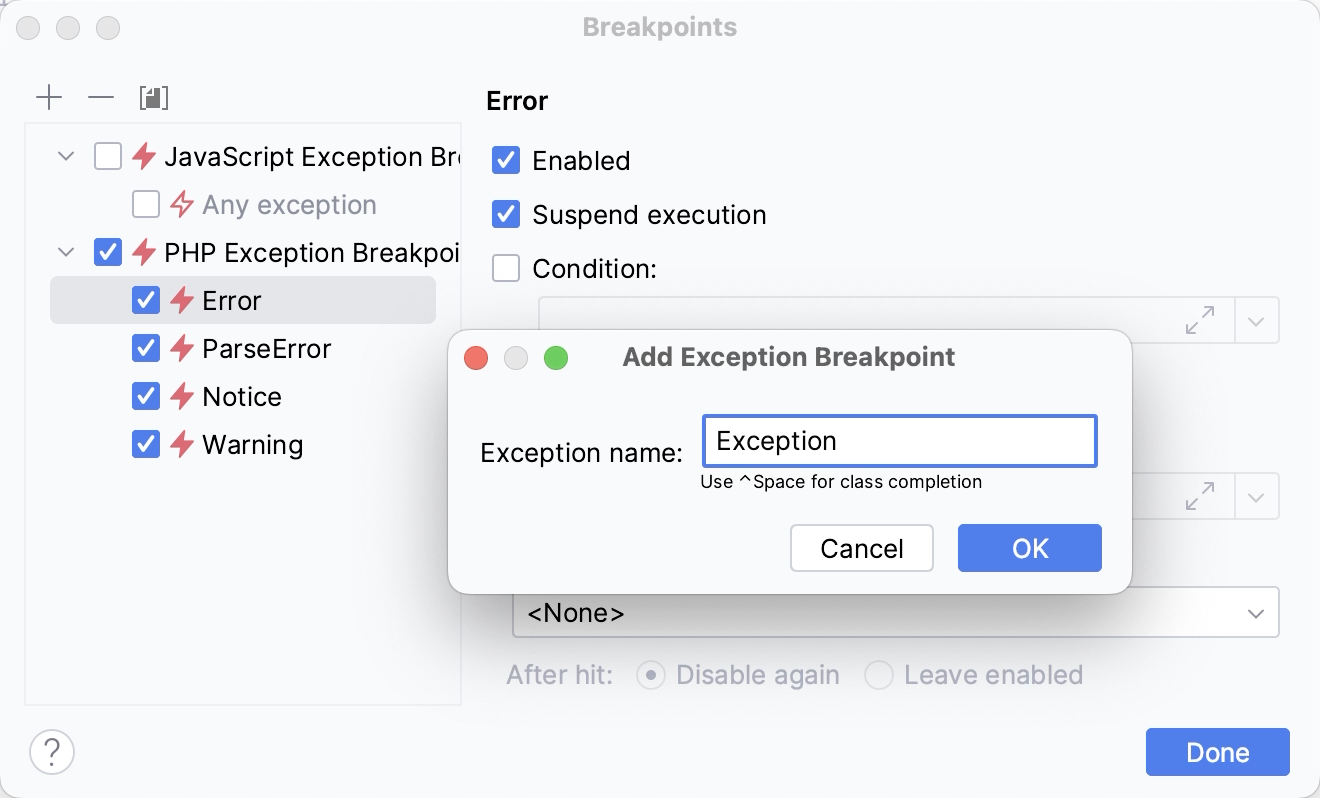
In the Breakpoints dialog, press Alt+Insert or click
 and select PHP Exception Breakpoints.
In the Add Exception Breakpoint dialog that opens, enter the name of the exception/error type on which you want the debugger to break. The Exception name text input field accepts the following values:
Exception,Error, and other PHP's built-in exception classes (for example,TypeErrororParseError).User-defined classes extending the
Exceptionbase class (for example,MyException).Warning.Notice.Deprecated.
Examine the suspended program
To see the breakpoint type, hover over the breakpoint icon in the editor to display the tooltip.
The Variables pane displays a fake
Exceptionvariable which shows the exception message and the exception code.
To get more information about PHP errors, add a watch to the
error_get_last()function and examine the details of errors in the Watches pane.