Zend server
Zend Server seamlessly integrates with PhpStorm, providing advanced features for debugging and profiling your web applications.
Zend Server is an integrated platform for mobile and web apps, helping in all phases of the application lifecycle. Zend Server includes Z-Ray, which gives unprecedented, in-context visibility inside apps, by showing in real time what exactly happens to construct each page. It helps developers write better code, detect and fix issues earlier, and collaborate with the operations staff to resolve production problems faster.
In this tutorial we’ll look into how to configure integration and proceed with debugging, profiling, or deploying your code, as well as using many built-in tools with PhpStorm, while Zend Server takes care of your PHP environment.
The following video will walk you through getting started with Zend Server:
For more information about Zend Server configuration and usage, refer to the Zend Server Documentation.
Getting started
There are two main ways to install Zend Server: locally, by downloading the application from the Zend’s web site, or by running it in the cloud (for example, in a special Amazon Web Services instance).
Installing Zend Server locally (or on a remote server)
Register for a Zend account and download the Zend Server application for your operating system from the Zend’s web site. Several versions are available differing by the PHP interpreter version.
Follow the steps of the installation wizard and complete the installation.
Using Zend Server in the cloud (AWS)
Different editions of Zend Server are also available in the AWS marketplace. With Zend Server running at Amazon Web Services, you can run high-performance, elastic, and dependable PHP-based Web & Mobile apps in the cloud.
Zend Server software offers a 30-day trial for, but AWS charges for the instance do apply. If you've never used AWS before, you may qualify for a full year of EC2 usage at no charge through the AWS Free Tier program (new cloud users only).

You will be offered to select the parameters of the instance (such as configuration of the VM, region, security settings) and generate a new key pair to access the instance. Review all settings and proceed with AWS instance configuration.
After the procedure is completed, go to the AWS console to manage the newly created instance with Zend Server installed.

For more information, refer to the video tutorial on Getting Started with Zend Server on AWS or check out the installation guide
Launching Zend Server
As soon as your Zend Server is installed and running, open it following the http://localhost:10081/ZendServer or https://localhost:10082/ZendServer links (replace localhost with the hostname you’re using. If you are using an AWS instance, the address will be similar to http://ec2-54-195-230-127.eu-west-1.compute.amazonaws.com:10081/).
On the next step, you will be offered to read and accept the License Agreement, and configure some initial parameters:
Profile (Development / Production - Single Server / Production - Create or Join a Cluster) - Development profile suits most development environments
Cluster Configurations (in case you selected Cluster on the previous step)
Passwords
Standard library packages to deploy
After the configuration is completed, and you have successfully logged in, the Zend Server Guide Page is displayed:

For educational purposes, we’ll deploy a demo application from the Zend Server Guide Page. To learn how to prepare and deploy your own applications to Zend Server, refer to the Deployment to Zend Server with a ZPK package section. A demo application is a Zend Framework 2 skeleton application which includes customized monitoring and caching rules, events, recurring jobs, and statistical data.
We’ll be using a local version of Zend Server below, but all the actions and workflows apply to remote AWS or standalone installation as well (additional configuration notes are provided where applicable).
Deploy a Demo application
Click the Sample App button on the Zend Server Guide Page.

Enter the application name, path, and virtual host.

Check that the application prerequisites are validated.

Review the deployment summary and click Deploy to proceed with deployment.

After the deployment process is finished, you will be brought to Zend Server’s application list:

Here you can easily check information about the deployed application, check the status, proceed to monitoring, and perform other actions.
We recommend you to familiarize yourself with Zend Server before proceeding to the next step. The Zend Server Getting Started Guide provides a good starting point.
Debugging with Z-Ray & PhpStorm
Z-Ray is a browser tool window that displays all the under-the-hood details of a page request, across all the PHP scripts involved in building the page. Z-Ray is injected into the response coming from your PHP app and shown right in the browser you're using for development, so you get much greater insight without changing your development workflow.

SSH tunnel configuration for remote debugging
If you are using AWS or any other standalone remote installation of Zend Server, some configuration is needed to prevent your firewall from blocking debugger communications.
To get a remote session running, set up an SSH tunnel for the debug port (10137 by default). If you are running Linux or macOS, run the following command from your local terminal where PhpStorm is running:
If you are running Windows, do the following:
Download PuTTY
Convert the PEM file to a PPK file by running puttygen.exe, loading the PEM file, and saving the private key to the PuTTY's key format
Run the following command to set up the tunnel:
where: 10137 is the debugging port (can be changed in PhpStorm and Zend Server, see Additional Configuration section) remote-host.compute.amazonaws.com is the remote hostname where your Zend Server is installed ZS.pem is an authorization key (certificate generated by AWS or other authority) ubuntu is a username on remote host Depending on your local privileges, you may need to execute the terminal command from a superuser (with sudo.
The SSH tunnel should be established every time before you initiate a debugging/profiling session. It is not needed in the following situations:
If Zend Server and PhpStorm are running on the same machine.
If there is a direct link between Zend Server & PhpStorm and no firewall is configured.
Debug your Zend application
In PhpStorm, enable listening to incoming debug connections by doing any of the following:
Click
 on the toolbar/the status bar.
Select in the main menu.
This ensures that PhpStorm reacts when a debugging session is started on the web server and opens the Debug tool window automatically. Before starting a debugging session, make sure that either a breakpoint is set or the Break at first line in PHP scripts option is enabled on the Debug page of the Settings dialog Ctrl+Alt+S.
Set a breakpoint in your code by clicking in the editor gutter near the line you would like to break at.
Open your application running on the Zend Server with the Z-Ray bar enabled, click the Debug icon
 and select Debug Current Page.
Accept the incoming connection from Zend Debugger in PhpStorm.

PhpStorm will break at the breakpoint (or first line if that option is enabled), providing you with the workflow for debugging your application in the IDE.

Profiling with Z-Ray and PhpStorm
All the notes and additional configuration for remote debugging apply here as well.
Profile your Zend application
In PhpStorm, enable listening to incoming debug connections by doing any of the following:
Click
on the toolbar/the status bar.Select in the main menu.
This ensures that PhpStorm reacts when a debugging session is started on the web server and opens the Debug tool window automatically. Before starting a debugging session, make sure that either a breakpoint is set or the Break at first line in PHP scripts option is enabled on the Debug page of the Settings dialog Ctrl+Alt+S.
Open your application running on the Zend Server with the Z-Ray bar enabled, click the Debug icon
and select Profile Current Page.
An application profile snapshot will open in PhpStorm.
Make sure to select the Server in order to take advantage of context menu actions, such as Jump To Source, Quick Definition, Quick Documentation (more information about server configuration is available in the Additional Configuration section). You may need to set up mappings for your project in Settings | PHP | Servers. You need to use path mappings when the paths to the files processed by the server differ from the paths to the files in the project. A path mapping specified for a parent directory is automatically applied to all its subdirectories. If necessary, you can specify path mappings for any subdirectory or even an individual file separately.
Debugging and profiling with Zend Server and PhpStorm from Events List / Single Event
Zend Server is tracking everything that’s going on with your application. To easily see all the issues, use the list of monitoring events available at .
A debugging / profiling session can be initiated from the list of events with relevant actions (Debug in IDE, Profile in IDE, or Show in IDE). Before initiating a debugging / profiling session from the Zend Server side, make sure that the IDE is listening for debug connections. For more information, refer to Debugging with Z-Ray and Profiling with Z-Ray.

Deployment to Zend Server with a ZPK package
There is no GUI for Zend Server deployment in PhpStorm, but it still lets you prepare ZPK deployment packages. This can be done either by using a terminal or via the Command Line Tools integration.
We’ll focus on the second option, as it conveniently provides completion options for command line tool commands and parameters.
After preparing the ZPK package, we’ll deploy it to the Zend Server.
Create a command line tool for Zend Server deployment tool
In the Settings dialog (Ctrl+Alt+S) , go to .
Click
 , select Custom tool from the list, and set the tool visibility (project or global).
Set the path to the tool (/usr/local/zend/bin/zdpack in our case; for OS-specific paths, refer to the Zend Server documentation) and alias.

Apply changes and click
 to open the tool definition in the editor.
Find the link to Zend Server's deployment tool (zdpack) repository in the custom command line definitions directory and copy the entire XML from the repository to the opened editor tab.

You can now launch the zdpack command line tool by either selecting in the main menu or pressing Ctrl+Shift+X.
Prepare a deployment package in PhpStorm
Select a directory and use the
createcommand to prepare the skeleton of your ZPK package. This includes the XML descriptor file, the data folder and the hook scripts:zdpack create application-nameVerify that the resources have been created in the specified directory:
Data folder - The folder that will contain your application files.
Scripts folder - The hook script skeletons available for you to edit as needed, and existing monitoring and caching rules.
deployment.xml file - The template of the XML descriptor for you to edit as needed.
Perform the following actions:
Place your application files in the data folder. Edit the hook scripts according to your needs.
Edit the deployment.xml as needed. The XML template is comprised up of example elements. The required elements are
name,version, andappdir.Validate the package by using the
validatecommand
zdpack validate package-xml-descriptor-fileUse the pack command to pack the contents into a ZPK package. By default, the Deployment Tool will create the package in the working directory.
zdpack pack application-nameIn our case, to prepare the test application for deployment, we need to run the following commands:
zdpack create drupal8a zdpack validate drupal8a/deployment.xml zdpack pack drupal8aAs a result, drupal8a.zpk has been generated in the root folder of our project.
Deploy a package to Zend Server
Open and click Deploy Application.
Choose the ZPK package from the file system and follow the deployment steps. Accept the license agreement, validate prerequisites, and provide the required parameters.
Working with databases on Zend Server with PhpStorm
Zend Server integrates with various databases (MySQL by default), which can be very handy for development purposes. PhpStorm comes with Database & SQL support. Make sure to connect the IDE to the development instance of Zend Server to take advantage of these tools.
Additional configuration (optional)
Configuring integration with Zend Server
You can configure the Zend Server IDE integration parameters under , though this is usually optional. For example, the debug port can be changed here by triggering the Autodetect IDE settings option:

Note that debug port must be the set to the same value as in PhpStorm. If needed, the Debug port and the Settings broadcasting port can be changed in PhpStorm on the page of the Settings /Preferences dialog Ctrl+Alt+S.

If you experience problems with the Z-Ray system requests invoking the debugger multiple times in PhpStorm, make sure that the Ignore Z-Ray system requests checkbox is selected on the page of the Settings dialog Ctrl+Alt+S.
Setting Zend Server as a Server in PhpStorm
As soon as a debugging or profiling session is established between Zend Server and PhpStorm, Zend Server will be added as a PHP server in PhpStorm configuration. If necessary, you can modify its settings page of the Settings dialog Ctrl+Alt+S.

This server can be used at al later point to configure Run Configurations.
Configuring PHP interpreter in PhpStorm
Using a PHP interpreter bundled with Zend Server provides the advantages of a PHP interpreter installed in a production-like environment. This way, we can make sure there will be no inconsistencies when the application is deployed to production.
You can use a PHP interpreter, for example, to test with PHPUnit or Behat, or analyze your code by using PHP code quality tools.
The interpreter can be set up on the page of the Settings dialog (Ctrl+Alt+S) . For more information, refer to Configure local PHP interpreters.
Using the ZF Tool command line tool from PhpStorm
Configure zftool as a command line tool
In the Settings dialog (Ctrl+Alt+S) , go to .
Click
on the toolbar.In the Command Line Tools dialog, choose Zend Framework 1 Tool or Zend Framework 2 Tool from the list, and specify its visibility level (Project or Global).

When you click OK, the Zend Framework Tool dialog opens.
Provide the path to ZF Tool depending on the Zend Framework version used and choose one of the configured PHP interpreters from the PHP Interpreter list. For more information, refer to Configure local PHP interpreters and Configure remote PHP interpreters.
<Zend-Framework-home>/zf for Zend Framework 1.
<Zend-Framework-home>/zf.php or <Zend-Framework-home>/zftool.phar for Zend Framework 2.
Click OK to apply changes and return to the PHP Command Line Tool Support page. Optionally, click
 to edit the tool properties, or to customize the commands set. For more information, refer to Customize a tool.
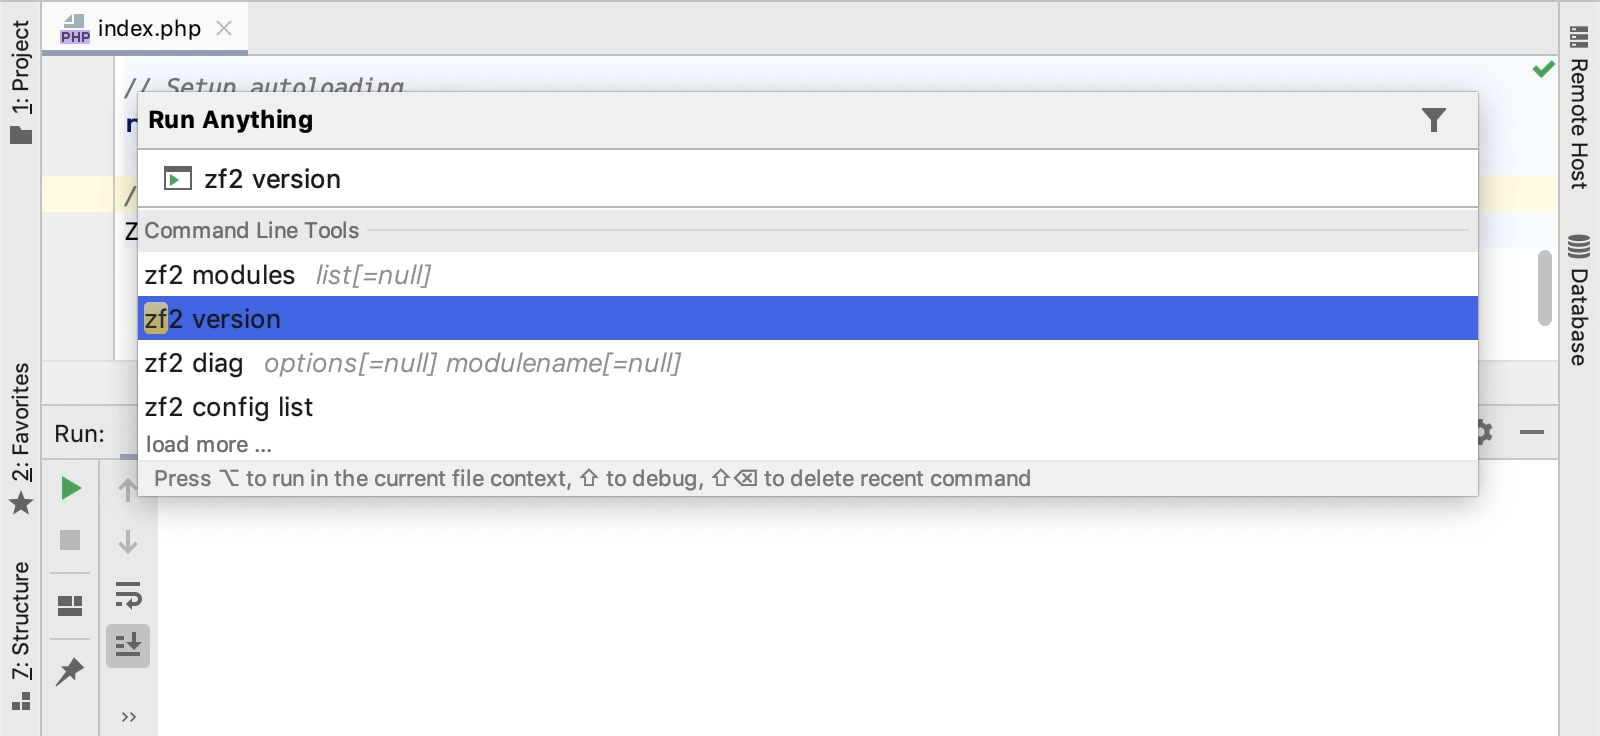
Run zftool commands
Go to or press Ctrl twice.
In the Run Anything window that opens, type the call of the command in the
<zf> <command>or<zf2> <command>format.The command execution result is displayed in the Run tool window.
Terminate a command
Click
 on the Run tool window toolbar.