Thread State
The Thread State filter is used to display and filter the collected time data by a thread state.
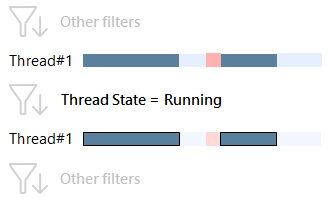
The idea of the Thread State filter is to "Select all time intervals where threads were in the specified state". For example, if you want to analyze only time intervals when a certain thread was not working, select the thread on Threads diagram and the Waiting state in the Thread State filter.
Any thread can be in one of the following states at a time:
-
Running
A thread is executing.
-
Waiting
A thread is not executing as it is waiting for a resource or notification from another thread.
-
Ready
A thread is ready to run on next available CPU.

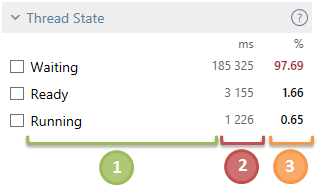
![]() State name.
State name.
![]() Time spent in this state summed up for all selected threads.
Time spent in this state summed up for all selected threads.
![]() The percentage of time spent in this state relative to the total selected time.
The percentage of time spent in this state relative to the total selected time.
For example, your application has two threads you are interested in: Thread#1 and Thread#2. Profiling lasted 50 ms. Thread#1 ran for 40 ms and waited for other threads for 10 ms. Thread#2 ran for 10 ms and waited for 25 ms, during the other 15 ms CPU had no time to process the thread (the thread was Ready). The Thread State filter for these two threads will look like follows:
Running 50 ms 50.00%
Waiting 35 ms 35.00%
Ready 15 ms 15.00%
To apply the Thread State filter:
- Check the desired thread state(s) in the filter.
After you select a state, other filters will show data only for the time intervals where threads were in the selected state.
