Running
The Running thread state indicates that a thread is currently being executed.
Select this state when you want to analyze the work done by a certain thread. For example, if you want to find out what method was executed most of the time in a thread, select the thread in Threads diagram and the Running state in the Thread State filter. The method will be displayed on the top of Top Methods in the Call Stack window.
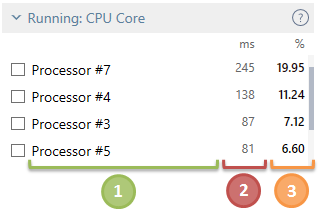
When the Running state is selected, the Filters window contains a sub-filter that allows you to refine the resulting filter: Running: CPU Core.
Running: CPU Core
This sub-filter shows distribution of work between logical CPU cores. The filter may be potentially useful in two scenarios:
- Evaluate whether it is worth to bind a thread to a single core (too frequent switching between cores leads to additional workload).
- Evaluate whether it is worth to divide a thread's job between a number of threads (in case the thread entirely loads a single core while other cores are not loaded).

![]() Logical CPU core number.
Logical CPU core number.
![]() Time when threads were run on this core summed up for all selected threads.
Time when threads were run on this core summed up for all selected threads.
![]() The percentage of time when threads were run on this core relative to the total selected time.
The percentage of time when threads were run on this core relative to the total selected time.
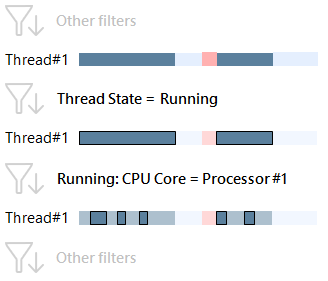
To apply the Running: CPU Core filter:
- Check the desired logical core(s) in the filter.
After you select a core, other filters will show data only for the time intervals where threads were run on the selected core.
