Filters
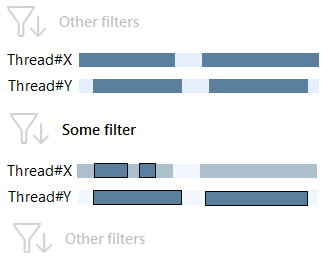
Performance Profiler contains a number of filters that allow slicing and dicing profiling data by various conditions. The result of filter's work is always a set of time intervals or point events selected by a specific condition.
Filters are the main analysis instrument in Performance Profiler.

To apply a filter:
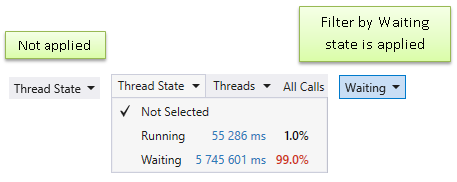
After the filter is applied, it becomes highlighted in the Performance Profiler window. Filter name is changed to the currently selected filter value.

To clear a filter:
- Click on the applied filter one more time.
To clear all filters:
Filter Types
The list of filters in the integrated viewer is identical to the one in the standalone Timeline Viewer. Therefore, if you need more information on how a particular filter works, refer to the corresponding section of the Analyzing Timeline Profiling Results | Filters chapter:
- UI Freeze
Time intervals where the application is unable to respond to user input. - Thread State
Filter time intervals by thread state (Running, Waiting). - Subsystems
Subsystems are used to quickly evaluate how time in a particular call tree is distributed among various components: user and system code, WPF, LINQ, collections, strings, and more. - Events
The group of filters which represent particular events related to the profiled application.- Memory Allocation
Memory allocation point events. - Native Memory Allocation
Native memory allocation point events. - Exceptions
Exception point events. - Garbage Collection
Time intervals where garbage collection is performed. - File Operations
Time intervals where read/write operations with disk or system cache are performed. - JIT Compilation
Time intervals where JIT compilation is performed. - SQL Queries
Time intervals where a client communicates with an SQL server. - HTTP Requests
Time intervals where a server processes incoming HTTP requests.
- Memory Allocation