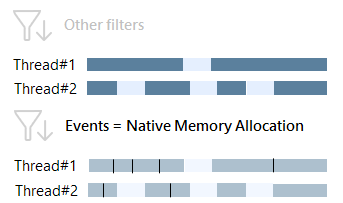
Native Memory Allocation
When Native Memory Allocation is selected in the Events filter, Timeline Viewer shows you how your application allocated memory to the native (unmanaged) heap. For example, Call Tree shows how much memory (in MB) a particular call has allocated.
Select the Native Memory Allocation event for analyzing all issues related to the native memory: potential memory leaks, issues with unmanaged components used by your managed code, and so on.
Note, that unlike the managed memory allocation event that is raised only when the size of allocated memory exceeds 100 KB in total, "native" memory allocation event is raised every time an allocation occurs regardless of the allocated memory size.
IMPORTANT! Currently dotTrace shows you only allocations of native objects that were not deallocated by the time of getting the snapshot. Thus, you cannot use this filter to analyze excessive native memory allocations (native memory traffic).
