Performance Profiler Concepts
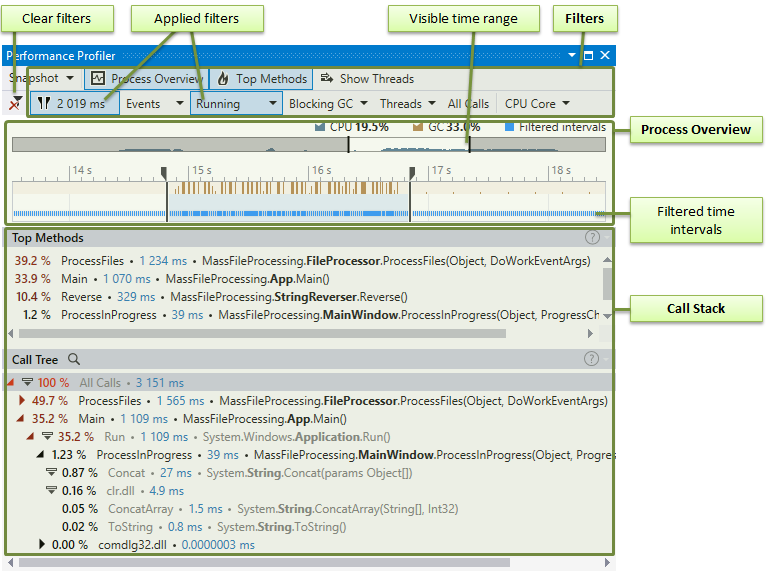
The Performance Profiler tool window () is a counterpart of the standalone Timeline Viewer tailored for use within Visual Studio. The functionality of both tools is almost identical (see the full list of differences). Thus, if you are new to timeline profiling and want to know more about the analysis workflow, refer to Timeline Viewer Concepts.
The Performance Profiler UI is made for convenient work with the event timeline: It is a set of filters and diagrams that allows you to filter and visualize temporal data.

The analysis workflow is pretty straightforward: All you do is slice and dice data using filters. The result of filters' work is always a set of time intervals or point events selected by a specific condition. For example, you can ask the viewer to "Select all time intervals where the Main thread is running" or "Select all time intervals where blocking garbage collection is performed". If you apply both of the filters, the resulting one will be "Select all time intervals where the Main thread is running during garbage collections" (in other words, where Main thread toggled GCs). Thus, using various filter combinations you can analyse almost any aspect of your application.