Controlling Profiling Session
After you configure profiling settings and run the session, the dotTrace Controller window opens*.

To manually control the profiling session, use the buttons on the dotTrace Controller window:
- Start - Click this button to start collecting performance data. It is displayed in the dotTrace Controller window if the Start immediately check box was not selected in the profiling options.
- Get Snapshot and Wait - Click to generate a snapshot and stop collecting performance data.
The alternative option (selected in the same drop down list) is:
Get Snapshot and Start - Click to generate a snapshot and continue collecting performance data. - Drop - Click to discard collected data and stop collecting performance data.
- Detach - Click to detach dotTrace from the profiled process, but keep the process running. Not available when using the Tracing or Line-by-line profiling types. The snapshot is not taken.
- Kill All - Click to kill all profiled processes. The snapshot is not taken.
- Stop Service - Click to stop a service. This button is displayed only when a Windows service is being profiled.
IMPORTANT: dotTrace Controller will automatically take a snapshot if you close the profiled application or the profiled application successfully finishes working by itself.
Profiling a Particular Application's Process
If your application runs more than one process, you can specify what process should be profiled.
To profile a particular process:

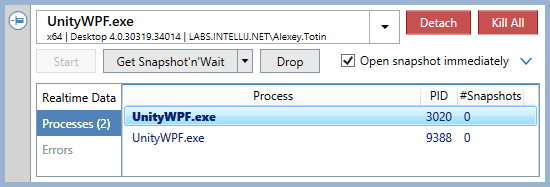
The Processes page shows process names (the Process column), PID, and a number of snapshots taken for each process (the #Snapshots column).
The currently profiled process is shown in bold.
Viewing Real Time Application Activity
To access additional functionality of the dotTrace Controller window, expand it by clicking the ![]() button.
button.
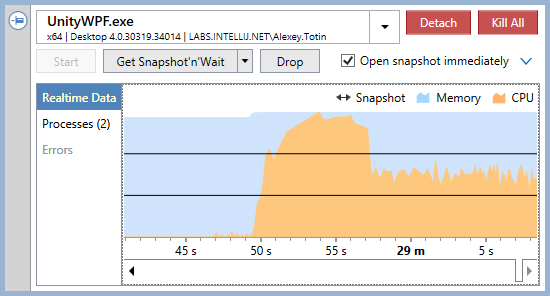
The Realtime Data page provides an overview of application activity showing CPU activity and memory consumption graphs.

Viewing Profiling Errors
The Errors page contains the list of errors that occur during profiling.