Configuring Profiling Session

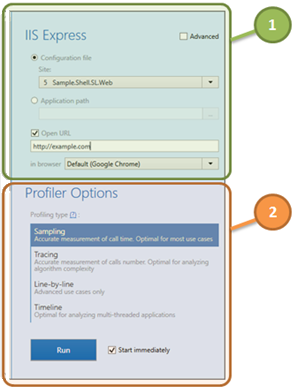
After you select the profiling target, you can proceed to configuring a profiling session. Depending on how you run dotTrace, the profiling session options will be shown either in a separate window or on the right panel of the Home window. The options are divided into two groups:
![]() Application Options
Application Options
These are options that depend on the application type. For example, if you profile a standalone app, you must provide a path to the app's executable. If you profile an ASP site, then you must specify the app's URL, and so on.
![]() Profiler Options
Profiler Options
These options define how dotTrace should collect data during the profiling session. Typically, all you need to choose here is a profiling type: what profiling method to use (performance or timeline) and what data should be collected more accurately (in case of performance profiling): a number of calls or calls time.