.NET Memory Allocations
When .NET Memory Allocations is selected in the Events filter, Timeline Viewer shows you how your application allocated memory to the managed heap. For example, Call Tree shows how much memory (in MB) a particular call has allocated.
Select the .NET Memory Allocations event for analyzing excessive memory traffic and garbage collections. The latter are one of the main reasons of UI freezes as the main thread can be suspended during a GC.
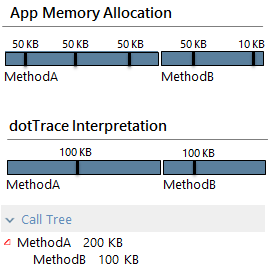
Note that allocation point event is raised only after the size of allocated memory exceeds 100 KB in total. For example, a thread allocates five 50 KB memory blocks during profiling. In such a case, dotTrace will detect only two allocations of 100 KB.

When you select the .NET Memory Allocations subject, Timeline Viewer adds the auxiliary Memory Allocation: Heap filter to the Filters window.
Memory Allocation: Heap
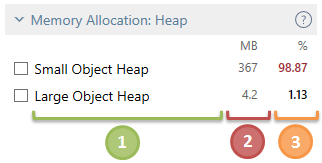
The Memory Allocation: Heap sub-filter is used to show distribution of allocated memory between small and large object heaps. The info about allocations to LOH allows you to evaluate how your application uses large data collections. This can be important for performance analysis as LOH is not automatically compacted and becomes fragmented over time.
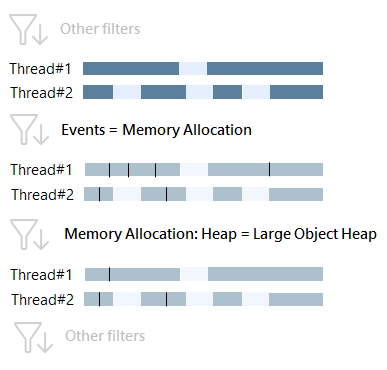
As a filter, Memory Allocation: Heap can be used to filter out point events where allocation to a certain heap takes place. For example, if you want to determine methods that allocate memory in LOH, select .NET Memory Allocations in the Events filter and Large Object Heap in Memory Allocation: Heap. The methods will be shown in the Call Stack window in Methods and Subsystems.

![]() Heap name: Small Object Heap or Large Object Heap.
Heap name: Small Object Heap or Large Object Heap.
![]() The size of objects allocated in the heap.
The size of objects allocated in the heap.
![]() The percentage of size of objects allocated in the heap relative to the total allocated memory.
The percentage of size of objects allocated in the heap relative to the total allocated memory.
For example, your application has two threads: Thread#1 and Thread#2. During profiling, Thread#1 allocated 8 MB to SOH and 1 MB to LOH. Thread#2 allocated 1 MB to LOH. The Events filter for these two threads will look like follows:
...
Memory Allocation 10 MB
...
The Memory Allocation: Heap filter will look like follows:
Small Object Heap 8 MB 80.00%
Large Object Heap 2 MB 20.00%
To apply the Memory Allocation: Heap filter
- Select the desired heap(s) in the filter.
After you select a heap, other filters will show only the point events where allocation to the selected heap took place. For example, Top Methods in the Call Stack window will show the list of methods that allocated objects in the heap.
