Controlling Profiling Session Through API
dotTrace API is a part of Profiling SDK *. The API provides a number of classes which allow you to control the profiling process. For example, you can start and stop collecting profiling data, save collected snapshots and so on right from your app.
For examples on how to use API, refer toAPI Usage Examples. For detailed information about API classes, refer toAPI Reference.
For more details on Profiling SDK implementation and usage scenarios, check this tutorial.
When to use the API
There are two main scenarios that require using the profiling API:
- Profiling a specific part of the code
API allows you to narrow the profiling scope and profile only methods you are interested in. - Self-profiled applications
API allows you to collect statistics about how your app behaves on end-user desktops.
How the API works
Timeline and performance profiling methods have slightly different API implementations.
Performance profiling
The following list summarizes main concepts of using API for performance profiling:
- The static
PerformanceProfilerclass located in the JetBrains.Profiler.Windows.Api.dll library provides methods for starting, stopping and cancelling profiling. - The
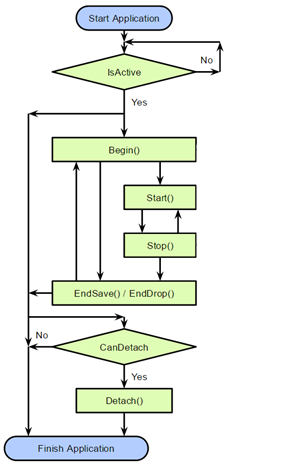
PerformanceProfilerAPI is organized as a simple state machine. - The
IsActiveproperty is used to determine whether the API is enabled. - Profiling must be started from creating a blank snapshot using the
Begin()method. - Profiling is not started initially, therefore
Start()should be called to begin profiling measurements. -
Stop()stops taking measurements. -
EndSave()stops taking measurements and opens the snapshot in the viewer. - To enable the API, you should select the Use profiler API check box in the advanced Profiler Options.
The API state machine: 
Timeline profiling
The following list summarizes main concepts of using API for timeline profiling:
- The static
TimelineProfilerclass located in the JetBrains.Profiler.Windows.Api.dll library provides methods for starting, stopping and cancelling profiling. - The
IsActiveproperty is used to determine whether the API is enabled. - Profiling must be started from creating a blank snapshot using the
Begin()method. This also starts measurements. -
EndSave()stops taking measurements and opens the snapshot in the viewer. - To enable the API, you should select the Use profiler API check box in the advanced Profiler Options.
Self-profiling
The following list summarizes "self-profiling" concepts:
- End-users do not have dotTrace installed; therefore, you must include dotTrace redistributables into your app's installation package.
- As end-users are not supposed to initiate profiling, the self-profiling session is initiated by the API. For this purpose, the API uses the static
SelfAttachclass located in the JetBrains.Profiler.Windows.SelfApi.dll library. - The
Attach()method prepares profiling configuration and executes the profiler from the "redistributables" folder. - The profiling configuration is defined by one of two classes (instantiated from the
BaseSnapshotProfilingConfigBaseProfilingConfigclasses) passed to theAttachmethod:-
SaveSnapshotProfilingConfig- the resulting snapshot is saved in the designated folder. -
ExecutableSnapshotProfilingConfig- the resulting snapshot is saved in the designated or default folder, the path to the snapshot is passed to an external application as a command line parameter.
-
- For performance profiling, there is a limitation on the profiling type - it can be only Sampling.