Get Started with Performance Profiling
dotTrace provides two methods for profiling your apps: performance and timeline. To some extent, both methods are interchangeable. Nevertheless, there are types of tasks where one or another profiling method is more suitable. For example, the performance profiling method described in this section is better suited for more straightforward "What is the slowest method" tasks, or for the tasks when you need to take an in-depth look at the line-by-line performance of a particular method or algorithm.
The timeline profiling method, in its turn, collects not only stack trace data but also the data about calls distribution in time. This method shows its best on issues where the order of events does matter: UI freezes, slow SQL requests, excessive garbage collections, and so on. For details on how to use timeline profiling, refer to the next tutorial.
Now, let's take a look at the simplest performance profiling workflow. For example, you have some application which does or does not have performance issues. So, all you want is to evaluate its performance, that is find out what methods take the most time.
Step 1. Running dotTrace
There are two ways to start profiling your application: you can either launch dotTrace as a standalone tool or from Visual Studio.
Running standalone dotTrace
This mode is ideal for applications where the original project or source code is not available or when you want to run dotTrace without having Visual Studio installed or launched. To run standalone dotTrace:
Start dotTrace from the Windows Start menu.

This will run the dotTrace Home window.
Running dotTrace from Visual Studio
Run Visual Studio.
Open the solution you want to profile.
In the menu, choose .
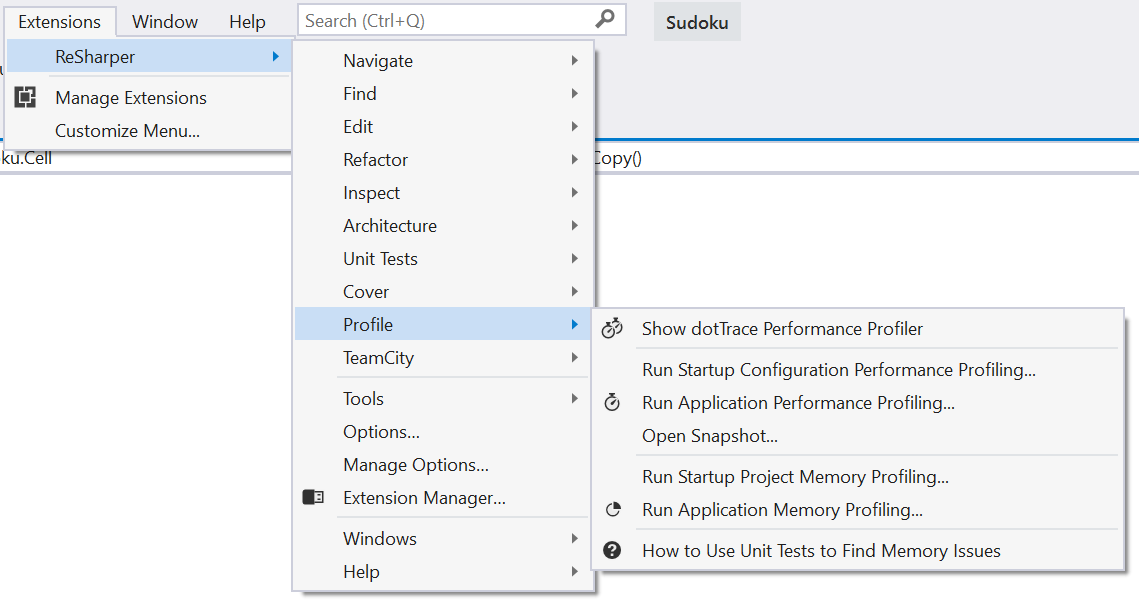
Step 2. Configuring and running profiling session
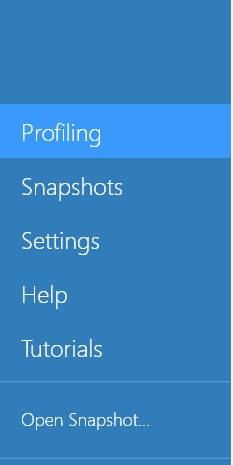
The next step is to configure the profiling properties and run a profiling session.
Make sure Profiling is selected in the left panel.
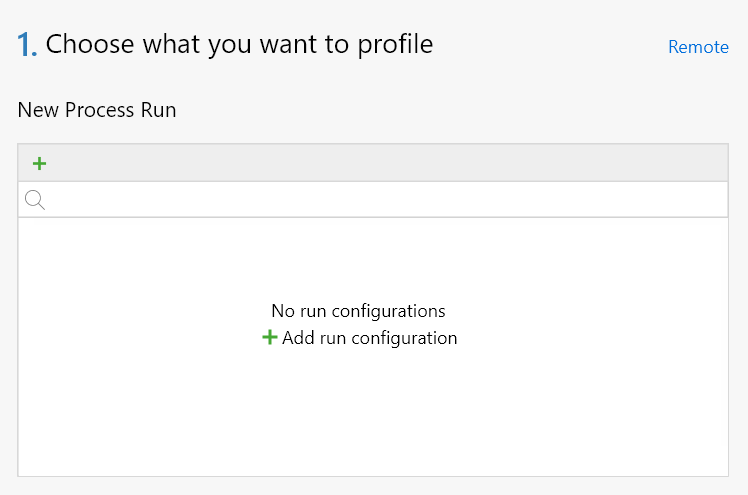
Now, you must add a run configuration - the configuration that tells dotTrace how to run the profiled application (the path to executable, arguments, and so on). Under Choose what you want to profile, New Process Run, click
 Add run configuration.
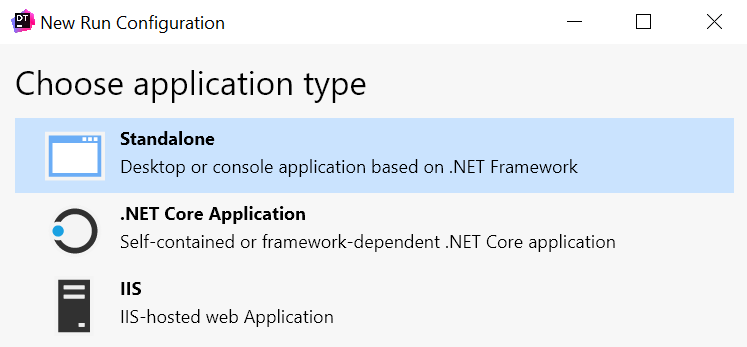
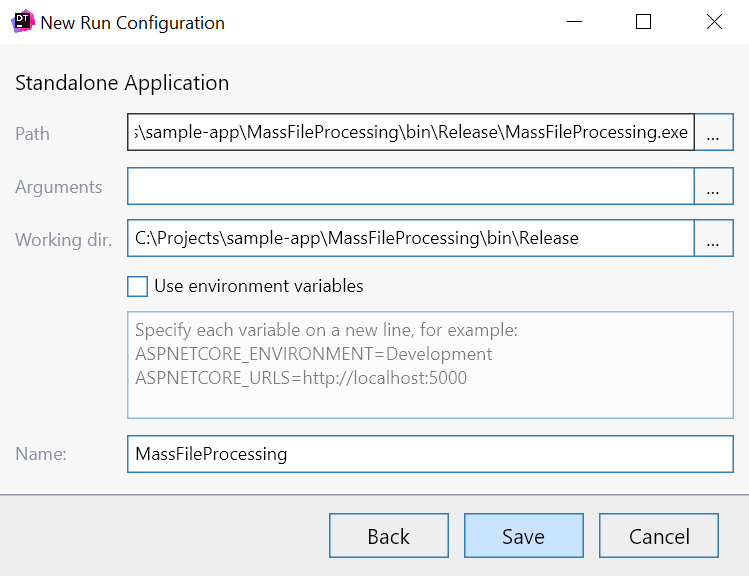
In the New Run Configuration wizard, first choose Standalone application and click Next.
Specify a Path to the application executable and executable arguments if required. Click Save.
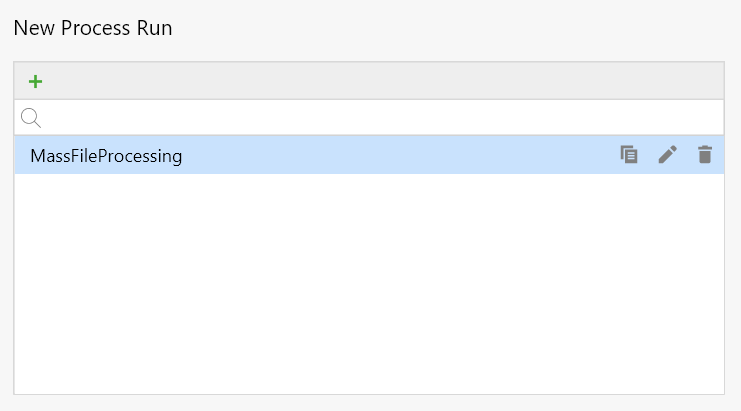
Make sure the created run configuration is selected.
Under Choose how you want to profile it, specify profiling options:
In Profiling Type, specify the profiling type. This is by far the most important profiling option. There are four types available:
Sampling- the fastest method. It accurately measures calls time, but doesn't get data on calls count. This profiling type lets you quickly get the basic understanding of the application's performance.
Tracing- slower than Sampling (and due to this it cannot measure calls time precisely) but accurately measures how many times a particular method was called. Use this method when Sampling data is not enough, for example for evaluating algorithms complexity.
Line-by-line- the slowest method that instruments each line of code. The line-by-line profiling makes sense only when you already know what function causes issues and want to analyze each line of it.
Timeline- the timeline profiling type. There is a separate tutorial about it.
Normally, if all you need is to evaluate the overall performance of the application, you should prefer the Sampling method.
Under Run profiling, click Run to start profiling. dotTrace will attach to your application's process and start collecting performance data.
Step 3. Getting snapshots
Once you run the profiling session, dotTrace will run not only the profiled application, but also the 'profiling controller'. It is a separate window used to control the profiling session - collect performance snapshots, detach from the profiled applications, and so on. Thus, your next step is collecting profiling data (or, in other words, taking performance snapshot(s)) using the controller window.

Work with your application: run the functionality which performance you want to check, go through a particular usage scenario, and so on.
Once you are sure that the collected profiling data is enough, click Get Snapshot and Wait in the controller window.
Close the profiled application. This will close the controller window as well.
Step 4. Analyzing snapshot data
After you close the profiled application, dotTrace will run a separate application - Performance Viewer. It lets you analyze the collected performance data using the handy UI.
The UI consists of a number of views that let you look at the data from different angles:
Hot Spots
You may want to start with Hot Spots. This view shows you the list of functions with the highest execution time. Use this view to find the slowest methods in just a glance.
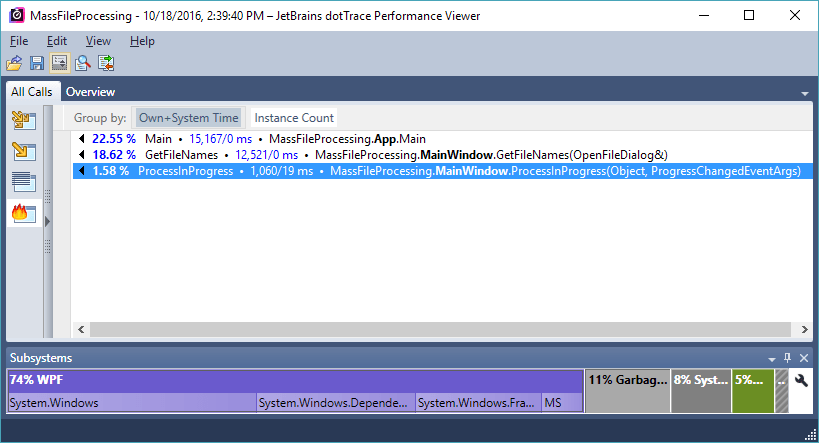
If you want to perform a more thorough analysis, you can use other Performance Profiler views: Threads Tree, Call Tree, and Plain List.
Threads Tree
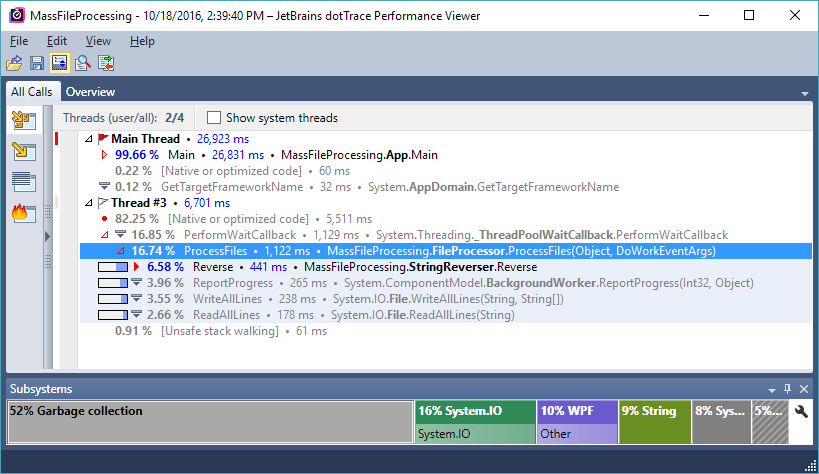
Lets you view and analyze threads activity in your application.
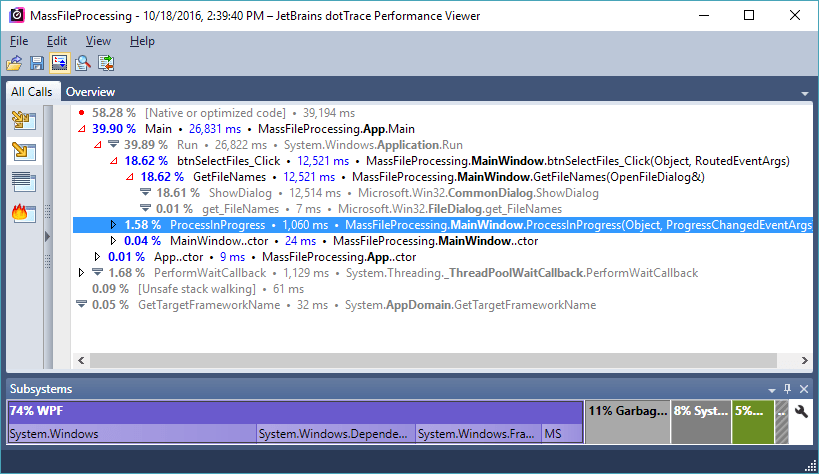
Call Tree
Call Tree shows you all method calls in all threads. Each top-level node represents a top-level function which was executed by a certain thread. Use this view to quickly get down to actual application activity:
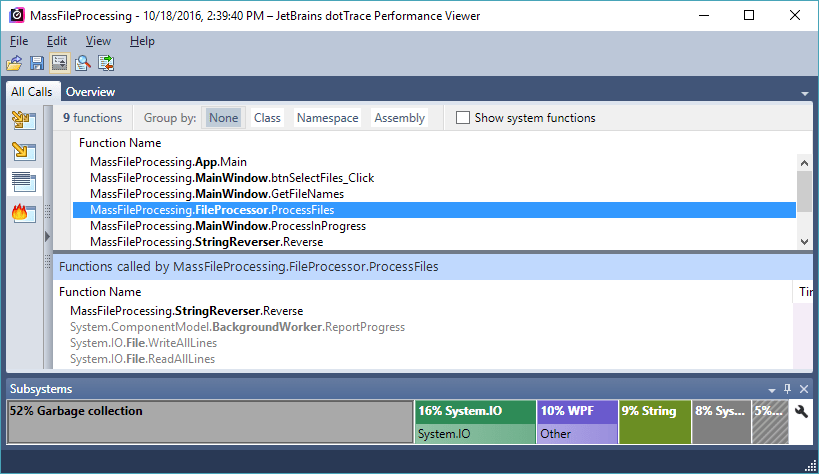
Plain List
Shows a plain list of methods. Lets you thoroughly analyze a particular method.
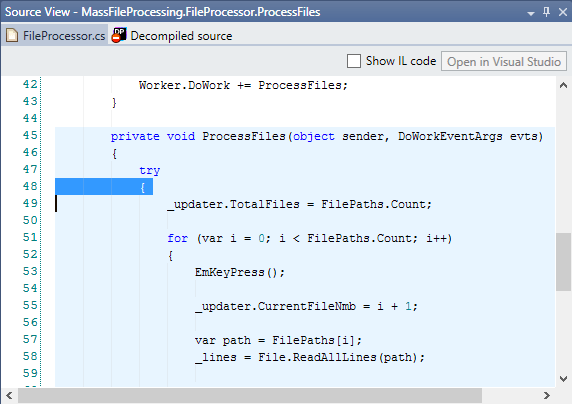
Source View
Note that whenever you select a method, Performance Viewer shows you the actual code for this method based on information provided by your application's debugging symbols. If no source code is available, Performance Viewer will try to decompile the method from the assembly.
Learn more
Once you've mastered these basics, learn the various techniques in analyzing profiler data. Performance Viewer includes great features like remote profiling, navigating through method calls, filtering and folding and estimating performance gains. Read about these and other features in particular sections of this guide.