Profile Web Application on IIS Server
Typically, determining performance issues in a web application is required when it is already running on a server. The table summarizes all possible options of profiling the application:
| Pros | Not cons but features | |
|---|---|---|
| Local profiling |
|
|
| Remote profiling |
|
|
| Profiling via console tools |
|
|
Local profiling

Typically, local profiling is used when you need to profile the app that is hosted right on your (developer's) machine or on some testing environment, which doesn't impose any security/performance restrictions.
To locally profile a web app hosted on an IIS server
Install dotTrace on the server.
Run dotTrace as a standalone application on behalf of Administrator. The dotTrace Home window will open.
Add a run configuration - the configuration that tells dotTrace how to run the profiled application:
Under Choose what you want to profile, New Process Run, click
 Add run configuration.
In the New Run Configuration wizard, choose IIS and click Next.
In Open URL, specify the URL of the profiled application. If you do not do this, dotTrace will start profiling of the first running application pool it'll be able to find.
Optionally, in in browser, specify the browser that dotTrace should use to open the URL.
Optionally, in Set environment variables, specify required environment variables. Each variable must be specified on a new line.
Click Save.
Make sure the created run configuration is selected in the New Process Run list.
Under Choose how you want to profile it, specify profiling options:
Profiling Type: typically, you should choose between Sampling (evaluate performance and determine slowest methods in your app) and Timeline (same as Sampling but with additional timeline data). Learn more about profiling types
If required, specify other profiling options.
If you want dotTrace to start collecting profiling data right after you start the session, under Run profiling, select Collect profiling data from start.
Click Start. This will start the profiling session.
Go through a particular workflow in your application (if you want to evaluate its performance) or reproduce a particular performance issue. Collect snapshots using the Get Snapshot button in the profiling controller window. Learn more about how to control the profiling session
After you collect the data, either close the profiled application or detach the profiler using the Detach button in the controller window.
Analyze the collected snapshots either in the Performance Viewer or Timeline Viewer (depends on the profiling type you select).
Remote profiling

Remote profiling is the best choice when it comes to a sudden performance drop/memory issue.
How it works: dotTrace is running on your local machine, the remote agent is running on the server, both communicating through TCP, as easy as that. The best thing about remote profiling is that you still work on your local machine – dotTrace copies and opens the collected snapshots automatically.
To remotely profile a web app hosted on an IIS server
On the web server, do the following:
Copy the RemoteAgent.zip file from the dotTrace installation directory on your local computer (by default, C:\Users\[username]\AppData\Local\JetBrains\Installations\dotTrace[N]) to any directory on the server.
Unzip the file on the server.
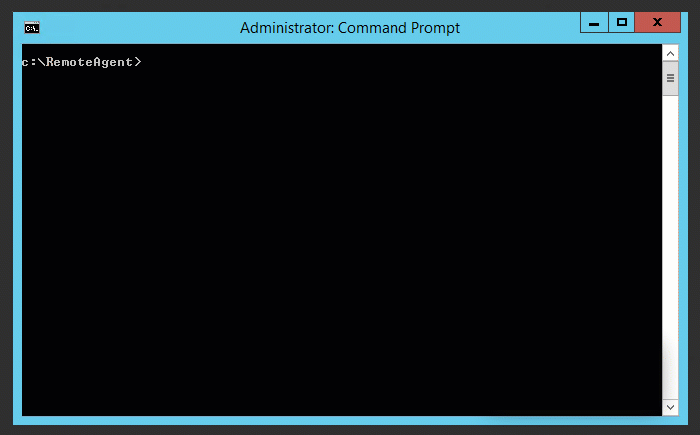
Start RemoteAgent.exe from the command line on the server.
Make sure the inbound connections to Remote Agent (by default, port 9100) are not blocked by the firewall.
Run dotTrace as a standalone application. The dotTrace Home window will open.
On the right from Choose what you want to profile, select Remote.
In the Remote Connection Settings window, in Remote Agent URL, specify the address of the remote agent service. By default, net.tcp://[remote_computer_IP_address]:9100/RemoteAgent
Click Connect to establish connection with the remote host.
Under Choose what you want to profile, Running Process, find and select the w3wp.exe process that corresponds to the app pool running the profiled application.
Under Choose how you want to profile it, specify profiling options:
Profiling Type: choose between Sampling (evaluate performance and determine slowest methods in your app) and Timeline (same as Sampling but with additional timeline data). Learn more about profiling types
If required, specify other profiling options.
If you want dotTrace to start collecting profiling data right after you start the session, under Run profiling, select Collect profiling data from start.
Click Start. This will start the profiling session.
Go through a particular workflow in your application (if you want to evaluate its performance) or reproduce a particular performance issue. Collect snapshots using the Get Snapshot button in the profiling controller window. Learn more about how to control the profiling session
After you collect the data, either close the profiled application or detach the profiler using the Detach button in the controller window.
Analyze the collected snapshots either in the Performance Viewer or Timeline Viewer (depends on the profiling type you select).
Profiling via console tools

Console tools are the best if you need to automate profiling: for example, you should profile your web app from time to time. Another possible scenario is when you don't have access to the server but some other person does, so you can provide them with profiling tools and a batch file.
How does it work? In short, you copy console tools to the server and either run the app under profiling (the app pool will be restarted) or attach the tool to the running application pool w3wp.exe.
To profile a web app on an IIS server using console tools
Download the zip archive with the dotTrace.exe tool and copy/unpack it to the server.
Now, you should start profiling of the application pool that hosts your application: you can either attach to an already running app pool or start a new one under profiling. Starting the new one doesn't give you any advantages over attaching, so, we'll take a look only at the latter (you can still find all the details in Working with dotTrace Command-Line Profiler ).
To attach dotTrace.exe to the running app pool:dotTrace.exe attach 1234 --save-to=snapshot.dtpwhere1234is the process ID of the corresponding w3wp.exe process.
Tip: To get the ID, in IIS Manager, open the required server. On Worker Processes page, you will find the list of running workers and their IDs.When it comes to taking performance snapshots, you have two options:
Get a snapshot by timeout:
dotTrace.exe attach 1234 --save-to=snapshot.dtp --timeout=5mhere the snapshot will be taken after 5 minutes, then the profiler will detach from the process.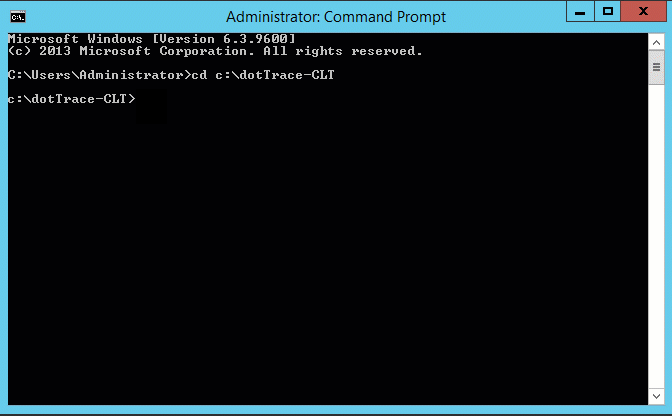
Get a snapshot on process exit. The dotTrace.exe tool will take a snapshot once the profiled application successfully finishes its work (so, if the app is "killed", no snapshot is collected). To make this happen, you can, for example, Recycle the corresponding application pool in the IIS Manager.
Copy the resulting snapshot to the computer with installed dotTrace and analyze it either in the Performance Viewer or Timeline Viewer (depends on the profiling type you select).
Note that it is normal that the snapshots contain large amount of native code.