Profile Unit Tests
There are three ways of profiling unit tests:
(Recommended) Using dotTrace integrated in Visual Studio
- Using standalone dotTrace
Note that if you use the API to control profiling, this is the only possible way to profile a unit test.
To profile unit tests using dotTrace integrated in Visual Studio
Open a solution in Visual Studio.
Open a file with unit tests.
Choose a test class or a test method.
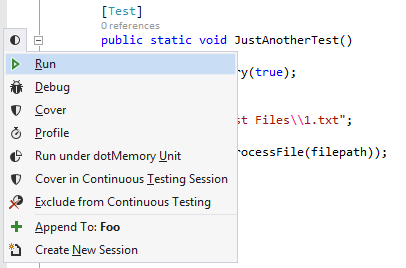
Click the corresponding side bar mark in the gutter.
In the context menu, choose Profile:

The Unit Test Sessions window opens.
Specify profiling options.
After test execution is completed, a snapshot will be opened in the corresponding viewer.
To profile unit tests from ReSharper's Unit Test Sessions window
Select a node in the tree view of the Unit Test Sessions window.
Click Profile Unit Tests
 in the toolbar.
Specify profiling options.
After test execution is completed, a snapshot will be displayed.
To profile unit tests using the standalone dotTrace
Run dotTrace as a standalone application. The dotTrace Home window will open.
Add a run configuration - the configuration that tells dotTrace how to run the profiled application:
Under Choose what you want to profile, New Process Run, click
 Add run configuration.
In the New Run Configuration wizard, choose .NET Core Application and click Next.
Depending on which unit testing framework you use, specify the path to its executable file in the Path field. Your can work with the following frameworks/executables:
nunit.exe for NUnit.
nunit-console.exe for NUnit.
MSTest.exe for MSTest.
xUnit-console.exe for xUnit.
Specify the path to the .dll file with your unit tests and add arguments (if necessary) in the Arguments field.
If required, specify a full path to the application Working directory (by default, it's the same directory where the executable is located).
If required, use Set environment variables to specify environment variables. Each variable must be specified on a new line.
Click Save.
Make sure the created run configuration is selected in the New Process Run list.
Under Choose how you want to profile it, specify profiling options:
Profiling Type: typically, you should choose between Sampling (evaluate performance and determine slowest methods in your app) and Timeline (same as Sampling but with additional timeline data). Learn more about profiling types
Optionally, if your application creates a number of processes and you want to profile only specific ones, create process filters.
For example, if you need to profile NUnit tests running under nunit-console.exe, note that NUnit test runner creates a separate process to run tests. Therefore you need to exclude the nunit-console.exe process from profiling. To do this, add the
nunit-console*filter.If required, specify other profiling options.
If you want dotTrace to start collecting profiling data right after you start the session, under Run profiling, select Collect profiling data from start.
Click Start. This will start the profiling session.
Go through a particular workflow in your application (if you want to evaluate its performance) or reproduce a particular performance issue. Collect snapshots using the Get Snapshot button in the profiling controller window. Learn more about how to control the profiling session
After you collect the data, either close the profiled application or detach the profiler using the Detach button in the controller window.
Analyze the collected snapshots either in the Performance Viewer or Timeline Viewer (depends on the profiling type you select).
Configuration examples
| Test Runner | Application | Arguments |
|---|---|---|
| nunit.exe for nUnit | Path to test runner executable. Example: "C:\Program Files (x86)\NUnit 2.5.3\bin\net-2.0\nunit.exe" | Path to the dll file with unit tests. Example: "C:\Projects\ConsoleApplication1\ConsoleApplication1Test\bin\Debug\ConsoleApplication1Test.dll" |
| nunit-console.exe for nUnit | Path to the test runner executable. Example: "C:\Program Files (x86)\NUnit 2.5.3\bin\net-2.0\nunit-console.exe" | Path to the dll file with unit tests and name of xml file where test results are stored. Example: "C:\Test progs\ConsoleApplication1nUnit\ConsoleApplication1nUnitTest.dll" /xml:C:\Temp\1.xml |
| MSTest.exe for MSTest | Path to the test runner executable. Example: "C:\Program Files (x86)\Microsoft Visual Studio 9.0\Common7\IDE\MSTest.exe" | Arguments:
|
| xUnit-console.exe for xUnit | Path to the test runner executable. Example: "C:\Prog\xunit-1.5\xunit.console.exe" | Path to the dll file with unit tests and name of xml file where test results are stored. Example: "C:\Projects\ConsoleApplication1\ConsoleApplication1xUnit\bin\Debug\ConsoleApplication1xUnit.dll" /xml 1.xml |
The resulting snapshot contains lots of information that pertains not only to the unit tests you're profiling but to test framework itself, making it a difficult task to extract information about unit tests. If you don't find unit test code in the snapshot at all, make sure the tests are actually running. In some cases MSTest stops before running tests due to inadequate permissions. If this is the case, try running dotTrace as administrator.