Run dotTrace
Depending on your needs, you can work with dotTrace in three different ways:
dotTrace installs in the Windows Start Menu for easy access.

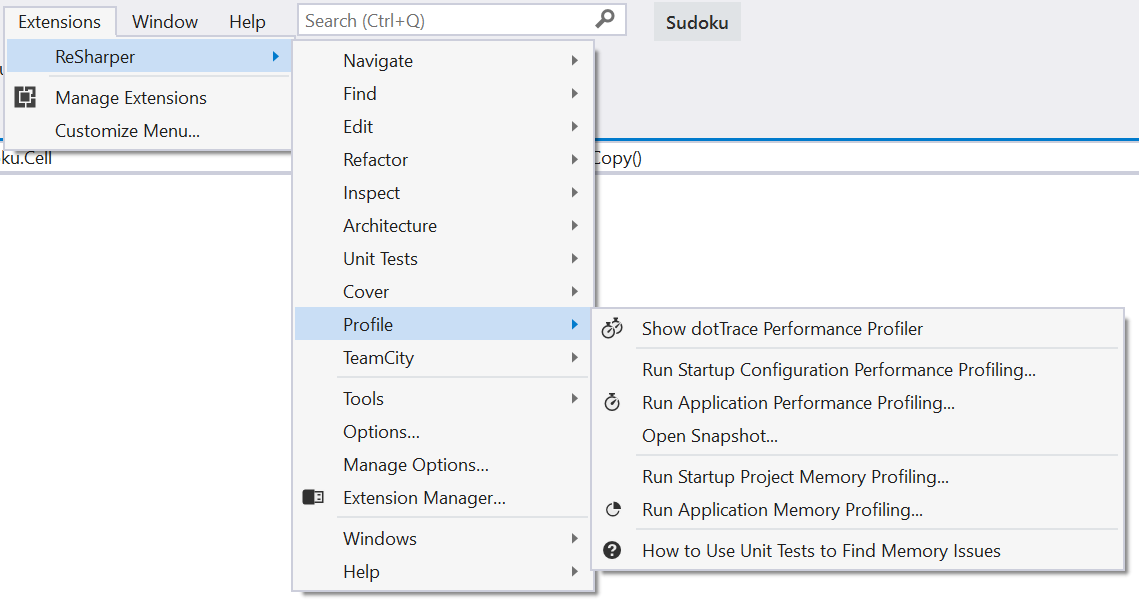
Using dotTrace integrated in Visual Studio.

The main component of dotTrace integrated in Visual Studio is the Performance Profiler tool window which can be opened in the menu.
The following table summarizes the pros and cons of each way.
Standalone | in Visual Studio | Command-Line Tool | |
|---|---|---|---|
Summary | Recommended if you do not have application's source code or you do not want to start an IDE to perform profiling | Recommended if you want to profile an existing project running under Visual Studio | Recommended if you want to perform profiling on a remote server or automate the profiling process |
How to Run Profiling | Using the dotTrace Home window | Using the menu in Visual Studio | Using the dotTrace.exe command-line tool |
Local Profiling | Additionally, profiling of run configurations is supported. For example, you are able to profile any static method in your code | Only profiling of standalone applications and already running .NET processes is supported | |
Remote Profiling | |||
Controlling Profiling Session |
|
|
|
Continuous Integration Support | The dotTrace plugin to TeamCity is available |