dotTrace Viewer Concepts
dotTrace Viewer is a set of filters and diagrams that allows you to filter and visualize profiling data.
Profiling types and the user interface
dotTrace Viewer user interface differs depending on the snapshot type you currently analyze. Sampling, tracing, and line-by-line snapshots provide less data than timeline snapshots. Therefore, the following tool windows and filters are not available for such snapshots: the Timeline diagram; Events, Interval Filters, Thread State, filters; Events, SQL Queries, Incoming HTTP Requests, File I/O tool windows, and some other UI elements.
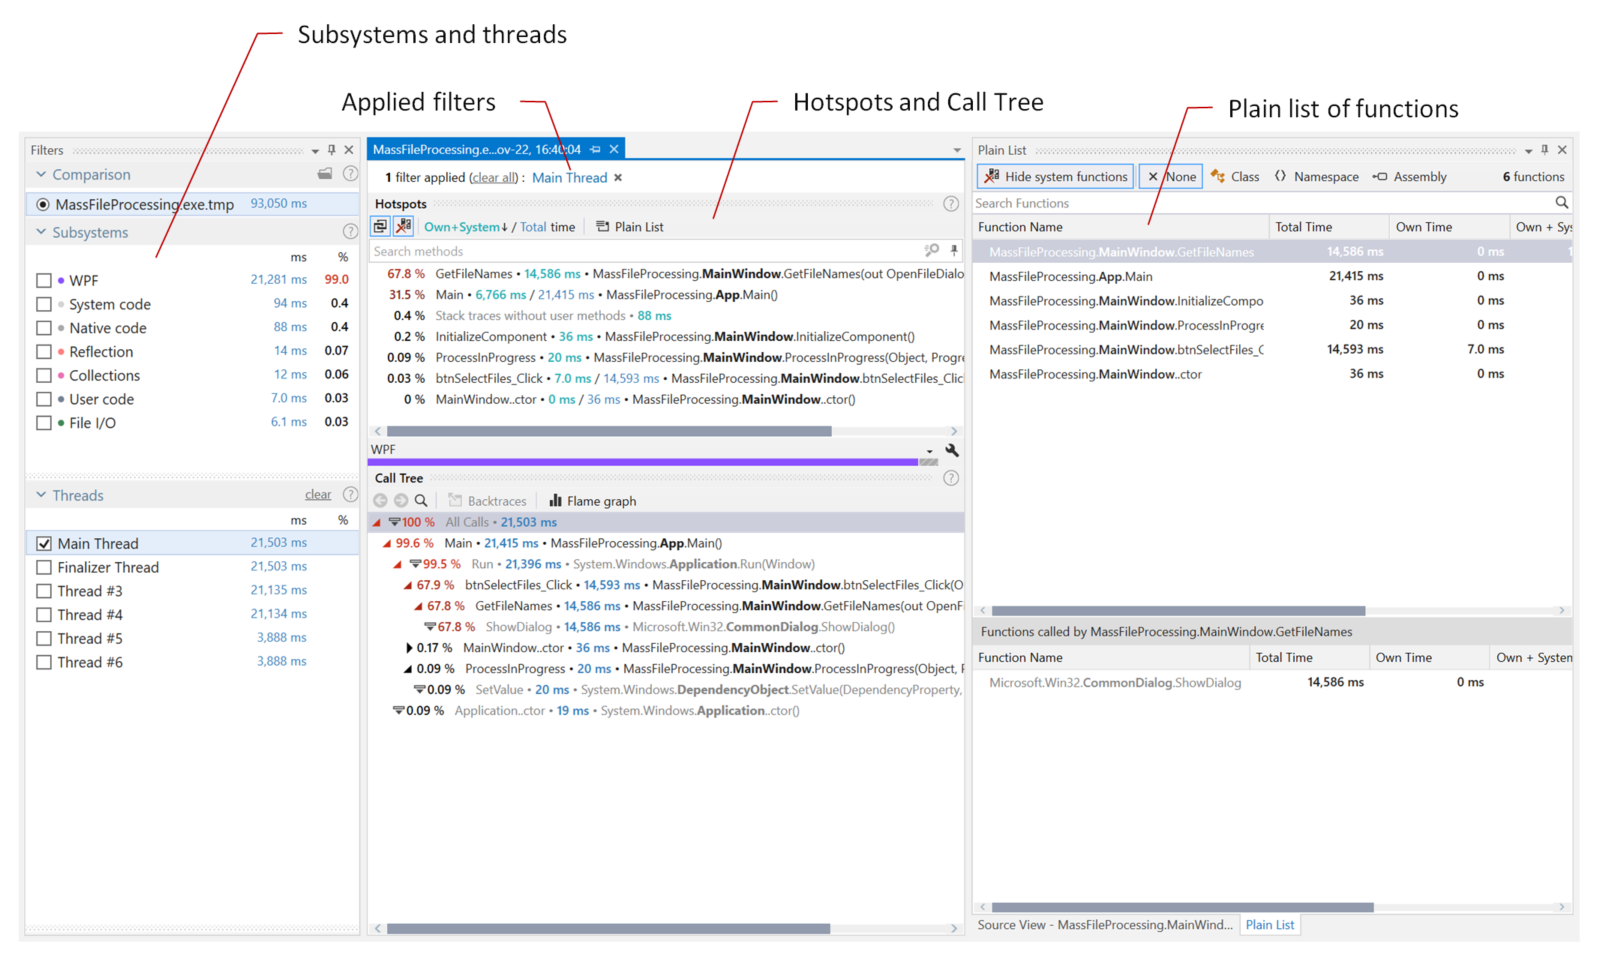
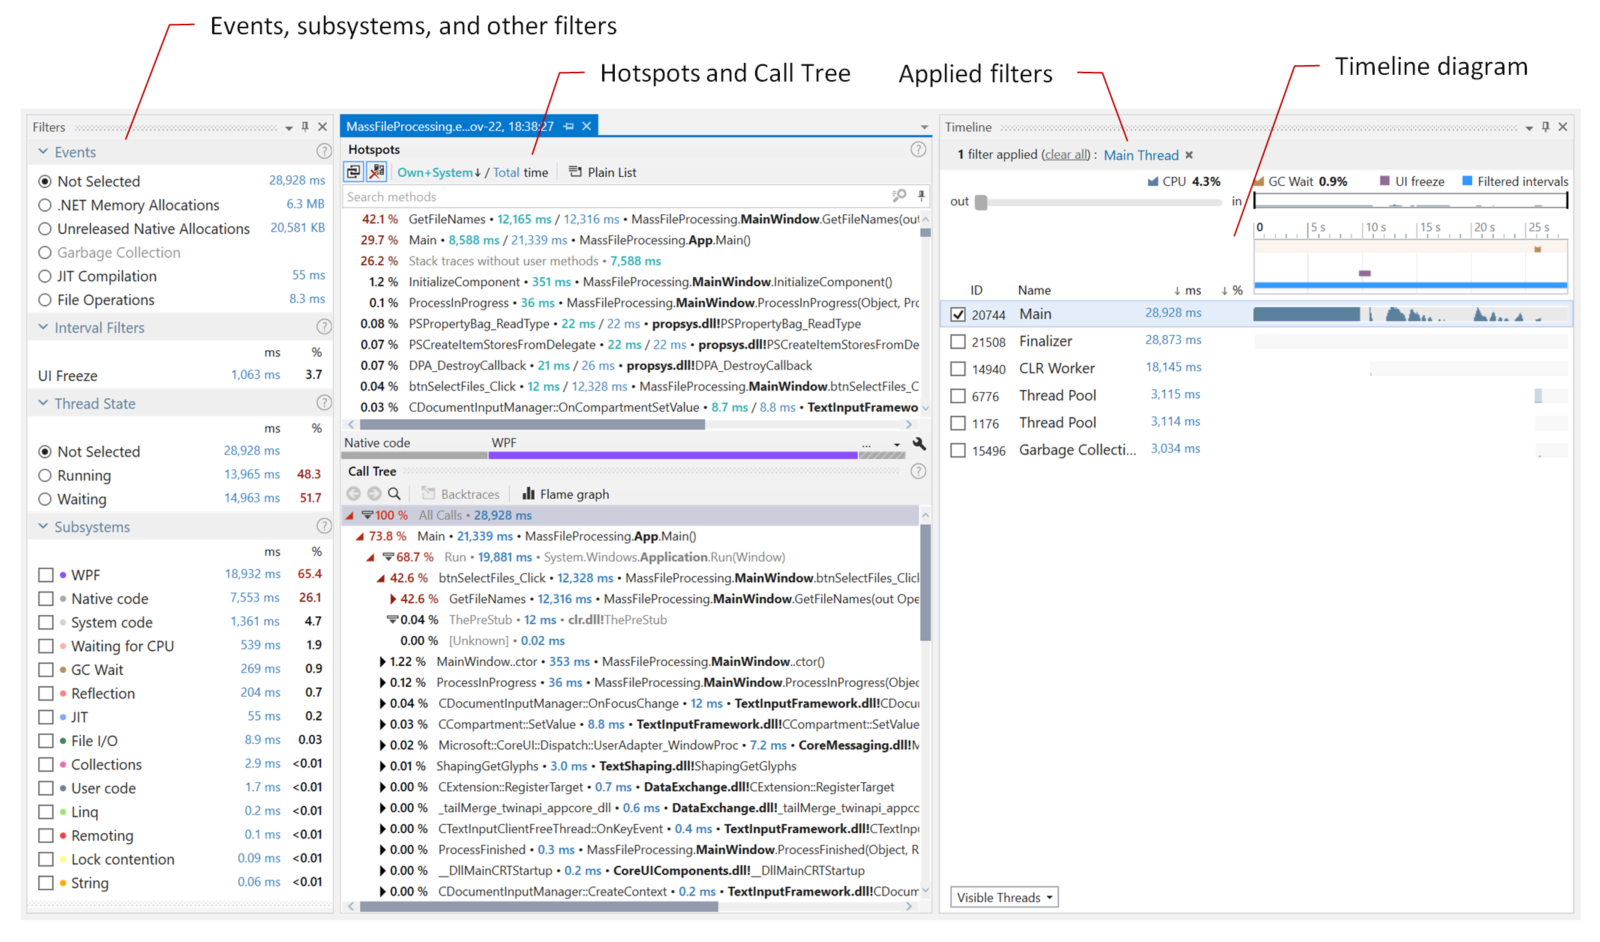
The images below show a sampling and a timeline snapshot of the same application opened in dotTrace Viewer:
Sampling | Timeline |
|---|---|
 |  |
As you can see, the timeline snapshot contains much more data: data about memory allocation, file operations, UI freezes, and other ETW events. In addition, there are much more subsystems available and unlike the sampling snapshot, you can select any time interval you're interested in on the Timeline diagram.
Analysis workflow
Snapshot analysis in dotTrace Viewer implies that you slice and dice the data using filters – Filters, Timeline/Threads, Call Stack, and others let you apply filters by time, thread, particular method, or other data. The result of filters' work is always a set of time intervals or point events selected by a specific condition. For example, you can ask the viewer to "Select all time intervals where the Main thread is running" or "Select all time intervals where MyMethod() works".
Here we come to a couple of concepts you need to know for successful data analysis in dotTrace Viewer.
- Everything is a filter
Each UI control in dotTrace Viewer is used not only to set a specific filter but also to display a chunk of filtered information.
For example, the Thread State filter not only allows you to apply a filter by thread state but also displays how long selected threads were in particular states.
- Filters are chained together
Filters can be grouped in chains. Complex filter combinations allow you to analyze almost any aspect of your app.
For example, if you combine the Select all time intervals where the Main thread is running and Select all time intervals where blocking garbage collection is performed filters, you will get the resulting filter Select all time intervals where the Main thread is running during garbage collections. In other words, this filter combination will leave only the time intervals where the Main thread toggled GCs. The Call Stack | Hotspots filter will show you the exact methods that toggled collections.
dotTrace Viewer integrated into Visual Studio
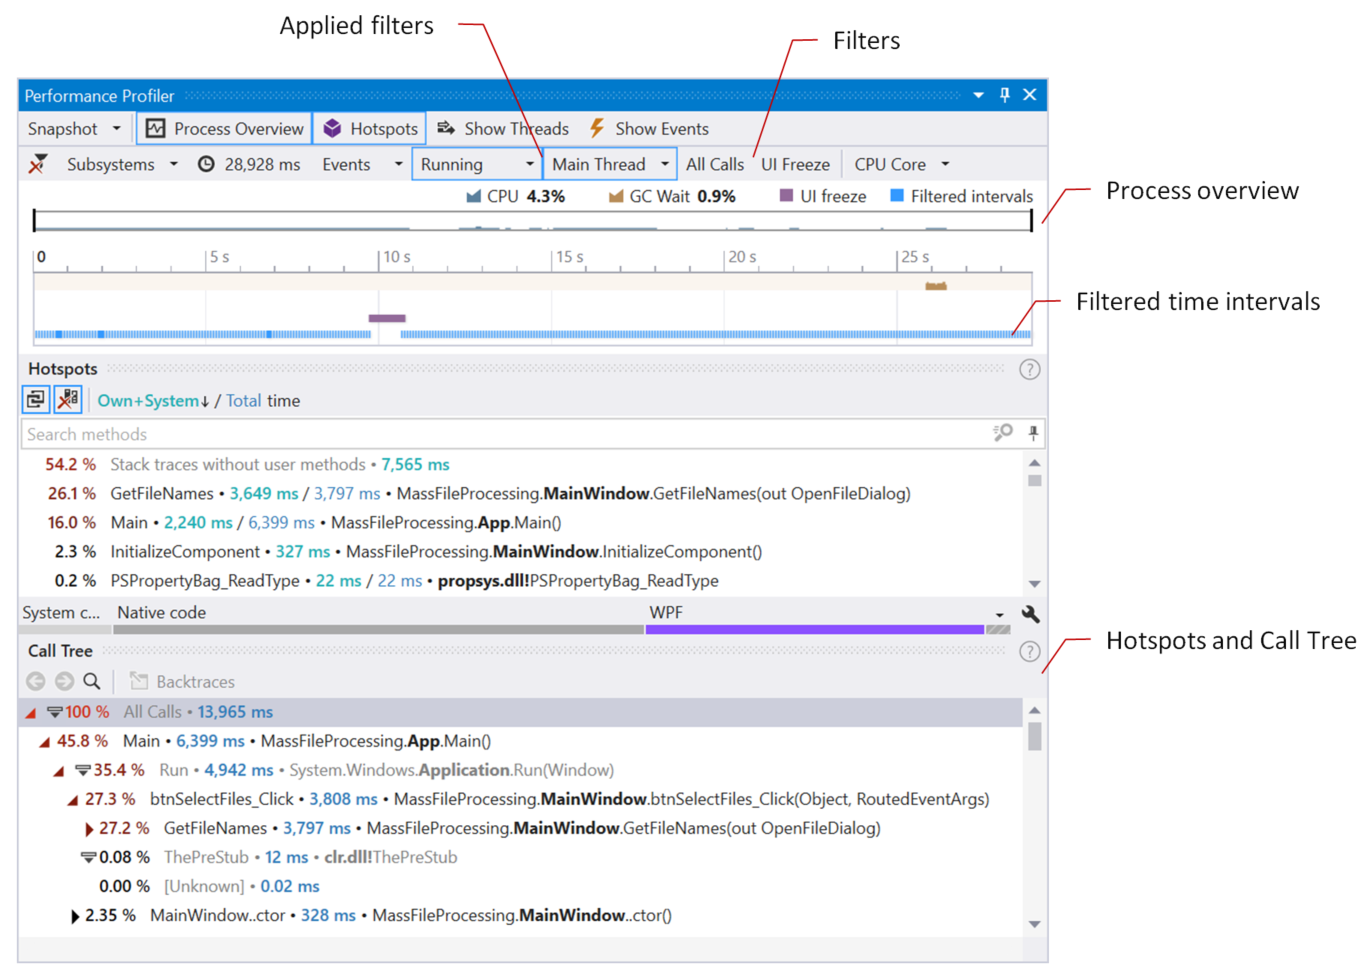
dotTrace Viewer in Visual Studio is represented with the Performance Profiler tool window (). It is a counterpart of the standalone dotTrace Viewer tailored for use within Visual Studio. The user interface of both tools is almost identical: the main difference is in how filters are shown on the main window (refer to the full list of differences).
