Hotspots
Hotspots shows the list of methods from all selected threads sorted by execution time.
Use Hotspots in conjunction with other filters to determine "top" methods by a certain condition. For example, to see "top" methods by file operations time, select the File Operations event in Events.

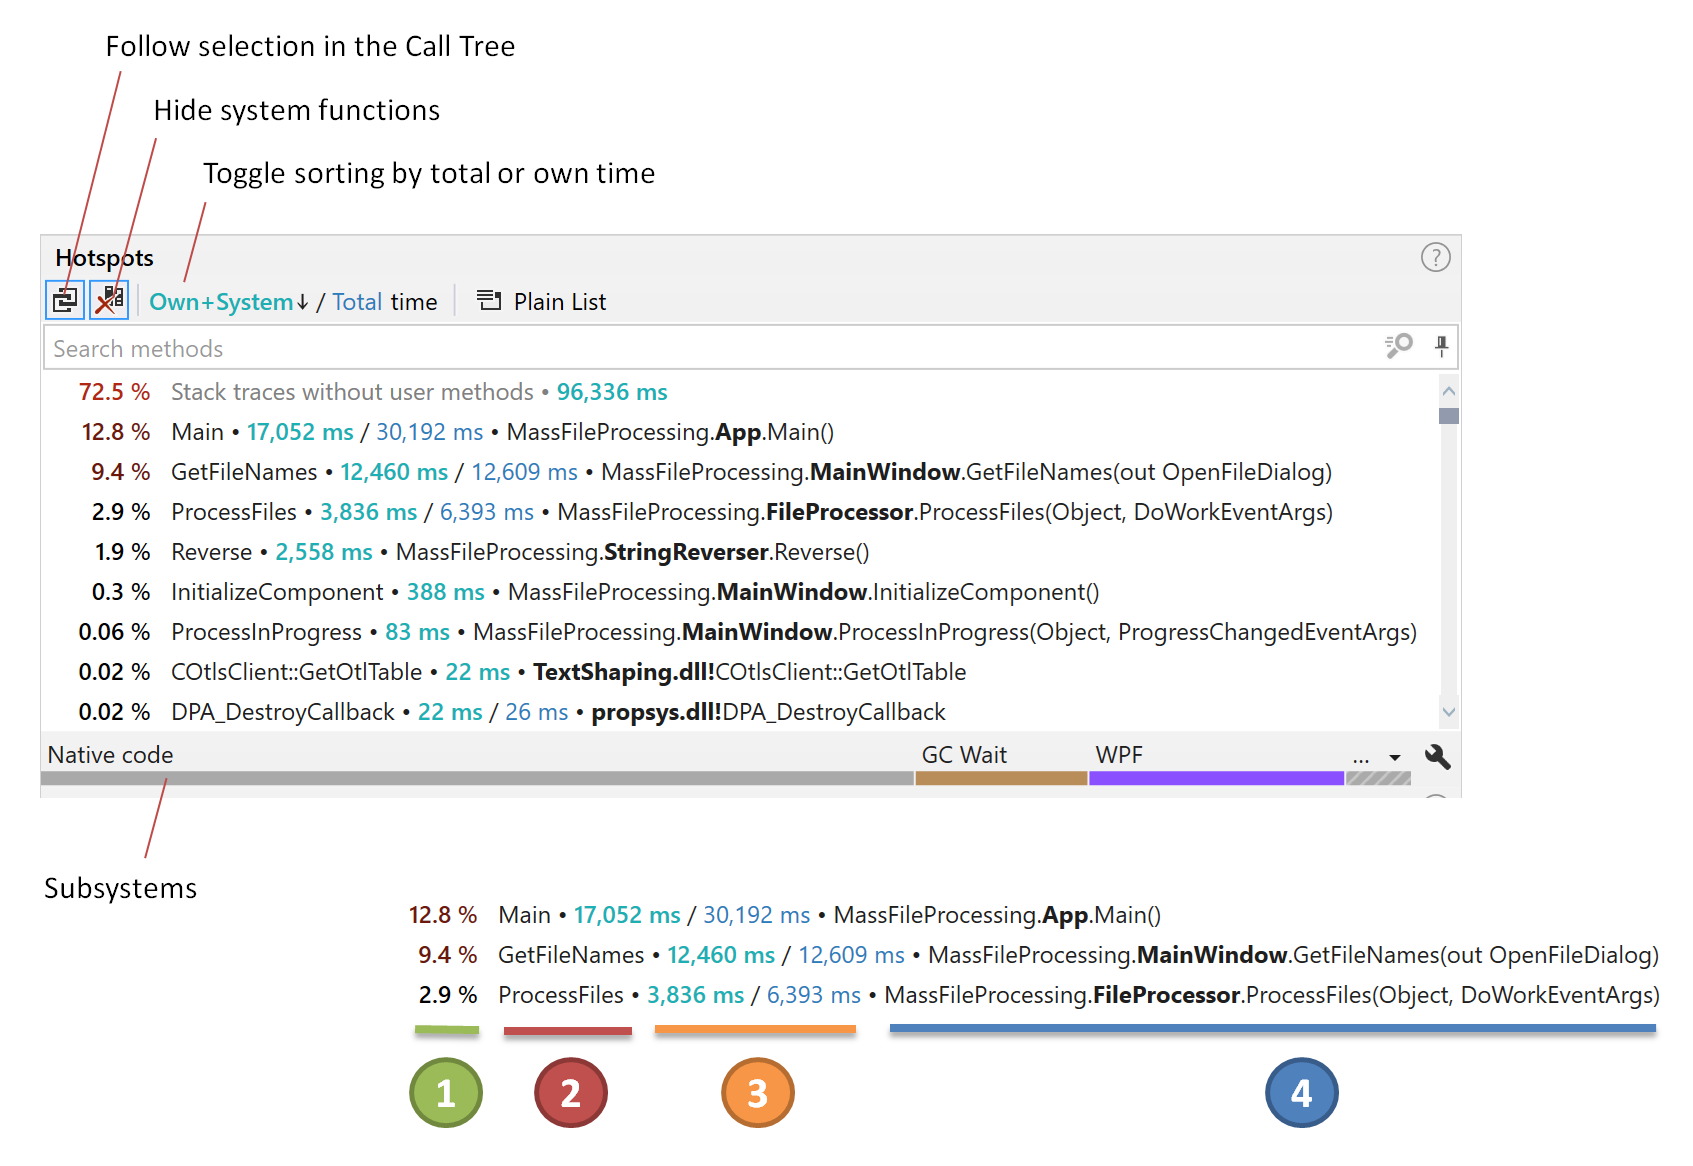
![]() The percentage of call execution time (total or own depending on the selected sorting) relative to the total selected time. If Follow selection in Call Tree is enabled, then relative to the total time of the call subtree selected in Call Tree.
The percentage of call execution time (total or own depending on the selected sorting) relative to the total selected time. If Follow selection in Call Tree is enabled, then relative to the total time of the call subtree selected in Call Tree.
![]() Short method name.
Short method name.
![]() Total / Own + System or Total / Own call execution time. See the details on how this time is calculated below.
Total / Own + System or Total / Own call execution time. See the details on how this time is calculated below.
![]() Full method name.
Full method name.
Follow selection in Call Tree – If this option is enabled, Hotspots are calculated for the node that is currently selected in Call Tree. Otherwise, Hotspots are calculated for the currently selected time intervals.
Hide system functions – See the details on this option below.
Subsystems – Subsystems allow you to quickly understand how the call time is distributed among various components: user and system code, WPF, LINQ, and others. The subsystems bar in Hotspots visualizes the data from the Subsystems filter.
How call time is calculated
If ![]() Hide system functions is enabled, Total call time is calculated as a sum of method's own time and time of all child calls.
Hide system functions is enabled, Total call time is calculated as a sum of method's own time and time of all child calls.
Own + System time is calculated as a sum of method's own time and the time of all child system methods (down to the next user method in the stack).
If ![]() Hide system functions is disabled, system methods are shown in the list separately. In this case, method's Own time does not include the time of child system calls.
Hide system functions is disabled, system methods are shown in the list separately. In this case, method's Own time does not include the time of child system calls.
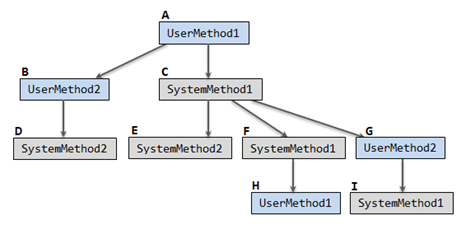
For better understanding, consider the example.

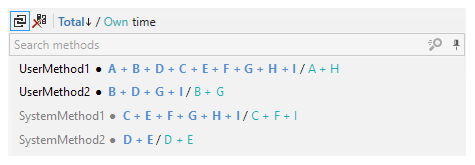
If ![]() Hide system functions is enabled, Hotspots calculates time (Total / Own + System) as follows:
Hide system functions is enabled, Hotspots calculates time (Total / Own + System) as follows:

If ![]() Hide system functions is disabled, Hotspots calculates time (Total / Own) as follows:
Hide system functions is disabled, Hotspots calculates time (Total / Own) as follows:

Navigate to source code
To navigate to a method declaration in the source code
Select the method.
Press Enter or choose the Navigate to Code (dotTrace Viewer integrated in Visual Studio) or Show Code (standalone dotTrace Viewer) item in the context menu.
(Visual Studio) To navigate from the source code to Call Tree and apply a filter by all method occurrences
In the source code in Visual Studio, do one of the following:
Right-click a method name and in the context menu, select .
Place the caret at the method name or anywhere inside the method and press Alt+Shift+S.
This also applies a filter by method occurrences and their subtrees.
Open methods in Call Tree
(Total time) To show all method occurrences in Call Tree
Select a method.
Press Ctrl + Shift + Enter, click the method's total time link or select the Merge Method Occurrences item in the context menu.
After this, the method becomes a root node in Call Tree containing call subtrees of all its occurrences. This also applies a filter by method occurrences and their subtrees.
(Own time) To show all method occurrences in Call Tree
Select a method.
Click the method's own time link or select the Filter by method's own time item in the context menu.
After this, the method becomes a root node in Call Tree and a filter by method's own time is applied. Note that all child calls are excluded from the subtree in this case.
View method's backtraces
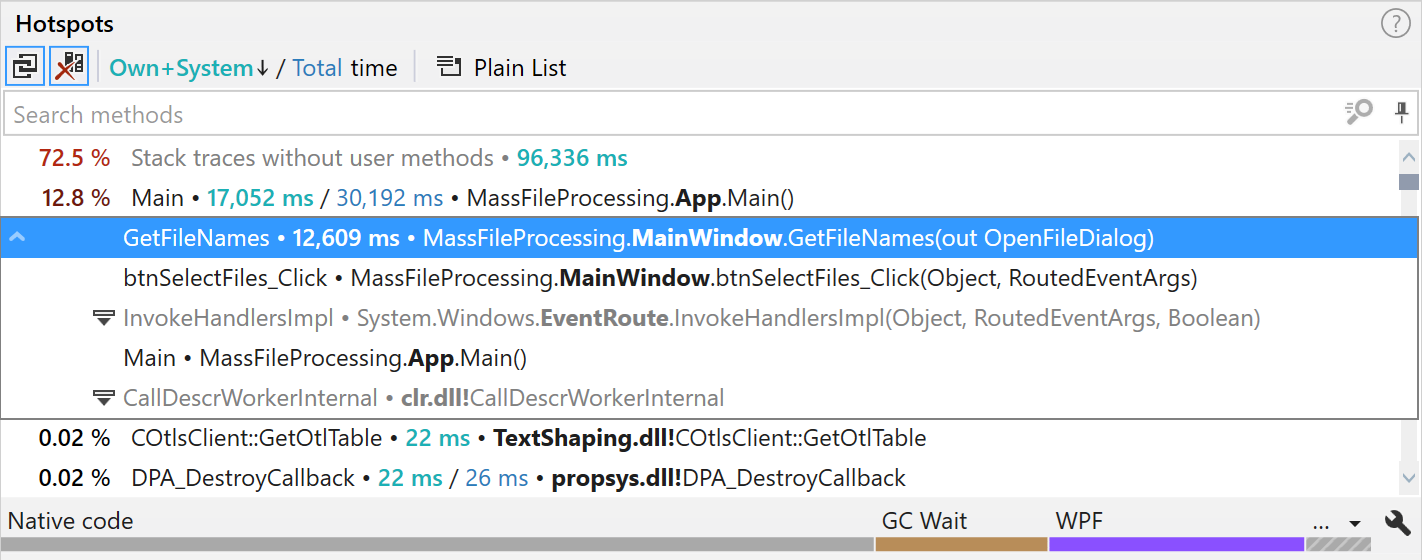
In some cases, it may be helpful to quickly view backtraces (an inverted call tree) of a particular method to identify its origin.
To quickly view backtraces of a particular method
Hover over the method.
Click the arrow symbol
 on the left.

Sort methods
To sort hotspots by total or own time
Click the Total / Own time link on the top of the Hotspots window.