Source View and Line-by-Line Profiling
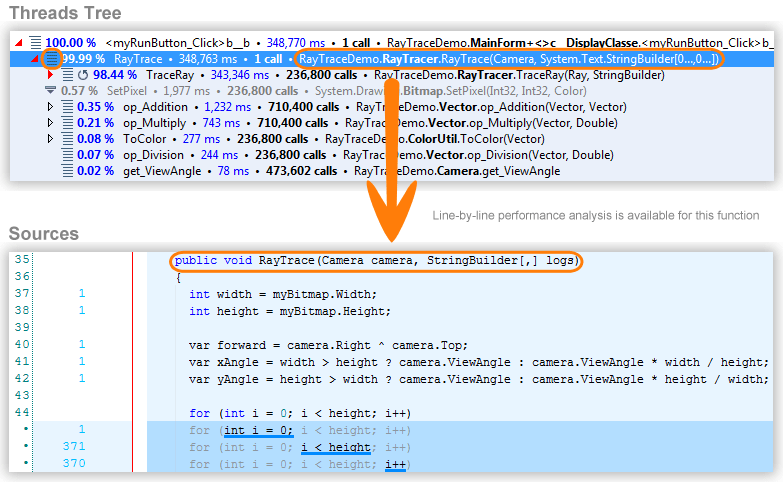
Depending on the chosen profiling mode, Source View may look different. With line-by-line profiling, performance analysis is available for some functions in Source View. Such functions are marked with ![]() icon in Call Tree, Threads Tree and Back Traces views.
icon in Call Tree, Threads Tree and Back Traces views.

If a statement consists of several statements, each of them is displayed on a separate line and highlighted with a blue line. On the left side you can see numbers that indicate how many times a particular statement was invoked during line-by-line profiling.
If you make IL code visible, a grey block of IL code is displayed under each statement for the selected method.

26 May 2024