Study Function Timings
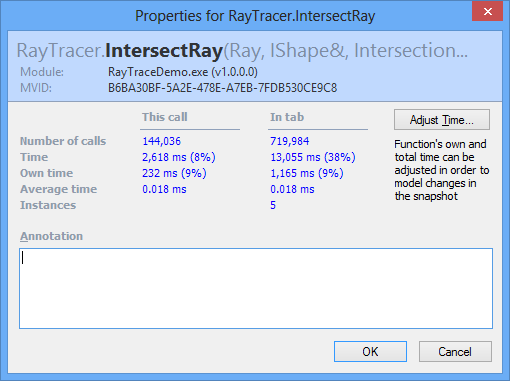
A function can cause performance problems in two possible ways: either it takes too much time to execute or it is called too often. When you find a suspicious function, you can determine which kind of the problem it poses by viewing function properties in the Properties dialog.
To view properties of a function
Select a function in a view.
Do one of the following:
From the menu, choose .
Right-click the function, then click Properties in the context menu.
Press Ctrl+Q.
The Properties dialog opens.
The Properties dialog provides a summary of function statistics with respect to the selected function call, to all calls in the current tab and in the whole snapshot.

The number of columns may vary depending on where you have launched the Properties dialog.
26 May 2024