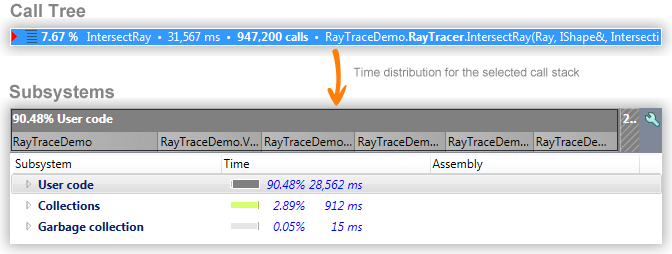
Simplify Analysis with Subsystems
Subsystems is a way of presenting profiling snapshot data which gives you a quick overview of time consumed by certain system components (various parts of .NET Framework, external libraries, your own code and so on). A subsystem simply groups all calls made within a certain namespace or assembly. For example, you can create a subsystem for System.Windows.Forms to summarize all WinForms calls in your app. This will show you how much time was required for interaction with your app.
Introduction, concepts, and configuration
Each time you select a node, dotTrace analyzes gathered data for the selected call stack and displays the contribution of various subsystems to the selected call stack. For better perception each subsystem has its own color. You can assign custom colors or use the default ones.
To define a new subsystem, you need to define a name, set a color and specify a rule or multiple rules.
To add a new subsystem
From the menu bar, choose . The Options dialog opens.
Click Profiles on the left pane of the Options dialog.
Click the arrow near
.png) Create new subsystem on the Profiles pane, then click Add empty subsystem.
Create new subsystem on the Profiles pane, then click Add empty subsystem.The Subsystem definition dialog opens.
Enter a new name in the Name field.
Click the area to the right of the Color label to open the Select Color dialog and choose the appropriate color.
Clear the Enable subsystem in current profile check box, if you want to disable the subsystem in the current profile.
Specify subsystem visibility options:
Show - the subsystem will be shown as a separate entry.
Join - subsystem's time will be calculated within calling subsystems. The subsystem will be shown separately only in case there are no subsystems to join with.
Hide - the subsystem will be hidden. Subsystem's time will be excluded from calculations.
For example,
MethodAbelongs toSubsystemAand callsMethodB(belongs toSubsystemB) which, in turn, callsMethodC(belongs toSubsystemC). If all subsystems are set to Show, subsystems time will be calculated as follows:
SubsystemA = MethodA
SubsystemB = MethodB
SubsystemC = MethodC
In case you setSubsystemBto Join, subsystems will be calculated as follows:
SubsystemA = MethodA + MethodB
SubsystemC = MethodC
In case you setSubsystemBto Hide, subsystems will be calculated as follows:
SubsystemA = MethodA
SubsystemC = MethodCClick Add and Clean to manage rules. All rules are displayed in the list.
Click OK to save the changes and close the Subsystem definition dialog.
You can also create a subsystem by duplicating an existing one.
To duplicate a subsystem
From the menu bar, choose . The Options dialog opens.
Click Profiles on the left pane of the Options dialog.
Click the arrow near
.png) Create new subsystem on the Profiles pane, then click Duplicate subsystem.
Create new subsystem on the Profiles pane, then click Duplicate subsystem.The Subsystem definition dialog opens.
If necessary, modify the name in the Subsystem name field.
Click the area to the right of the Color label to open the Select Color dialog and redefine the color.
Click Add and Clean to manage rules. All rules are displayed in the list.
Click OK to save the changes and close the Subsystem definition dialog.
At any time you can return back to existing subsystems and modify rules for them.
After all necessary subsystems are defined, you can tune the settings a bit more. All subsystems that should be taken into account can be gathered in one profile and arranged according to their importance. So a profile is just a set of important or active subsystems. It can have a name or be left unnamed.
If a method matches two rules from different subsystems, the rule from the subsystem that is upper than the other one in the list of subsystems is applied.
To create a new profile
From the menu bar, choose . The Options dialog opens.
Click Profiles on the left pane of the Options dialog. A new unnamed profile is created.
Click
.png) Add new profile on the Profiles pane.
Add new profile on the Profiles pane.In the list of profiles, an active field appears. Type a name for the new profile in this field.
In the list of subsystems, configure the set of active subsystems by selecting the corresponding check boxes.Optionally, you can reorder the sequence of subsystems. To do that, select the subsystem to be moved and click
.png) Move selected subsystem up or
Move selected subsystem up or .png) Move selected subsystem down.
Move selected subsystem down.Click OK to save changes.
When you have several profiles, you can switch between them in the Subsystems view and visualize those parts of assemblies that seem to be important right here right now.
If you are not satisfied with the changes you made to the subsystems configuration, you can quickly reset them to factory defaults using the Reset Defaults button.
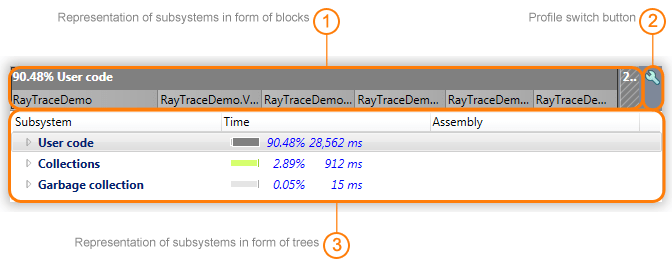
View description
By default, the Subsystems view is visible. If it is not so, select the Enable subsystem analysis check box on the Profiles page of the Options dialog. After that, dotTrace rebuilds the view each time you choose a new call stack.


![]()
The subsystem where most time is spent occupies the biggest block. This block in turn consists of smaller blocks that represent child subsystems.
![]()
Profile switch button helps you quickly change the profile according to which the view is built and rebuild it emphasizing other subsystems. You can also collapse or expand the view.
![]()
Subsystems are sorted by time. Each of them is displayed as a tree where leaf nodes are functions.
There are four separate subsystems that exist independently regardless of defined patterns and custom subsystems. All functions can be divided into two groups depending on their assemblies and can be included in System code or User code subsystems:
System code - all source code that does not match the rules in the chosen active profile and belongs to standard system libraries
User code - all source code that does not match the rules in the chosen active profile and does not belong to standard system libraries
For more information about moving functions from one group to another, refer to Apply Filters.
The remaining two subsystems are only for information about some activities in your application:
Garbage collection - all activities related to garbage collection
Special - all functions that do not belong to .NET libraries
If you don't need a tree view, you can switch to a smart mode. Double-click the top of the view and collapse it.
IMPORTANT! The page contains more "special" subsystems, like SQL Queries, Lock Contention, CPU Ready, and other. These subsystems are based on ETW events and are available only in dotTrace Viewer.