dotTrace Viewer Concepts
dotTrace Viewer is a set of filters and diagrams that allows you to filter and visualize profiling data.
Profiling types and the user interface
dotTrace Viewer user interface differs depending on the snapshot type you currently analyze. Sampling, tracing, and line-by-line snapshots provide fewer data than timeline snapshots.
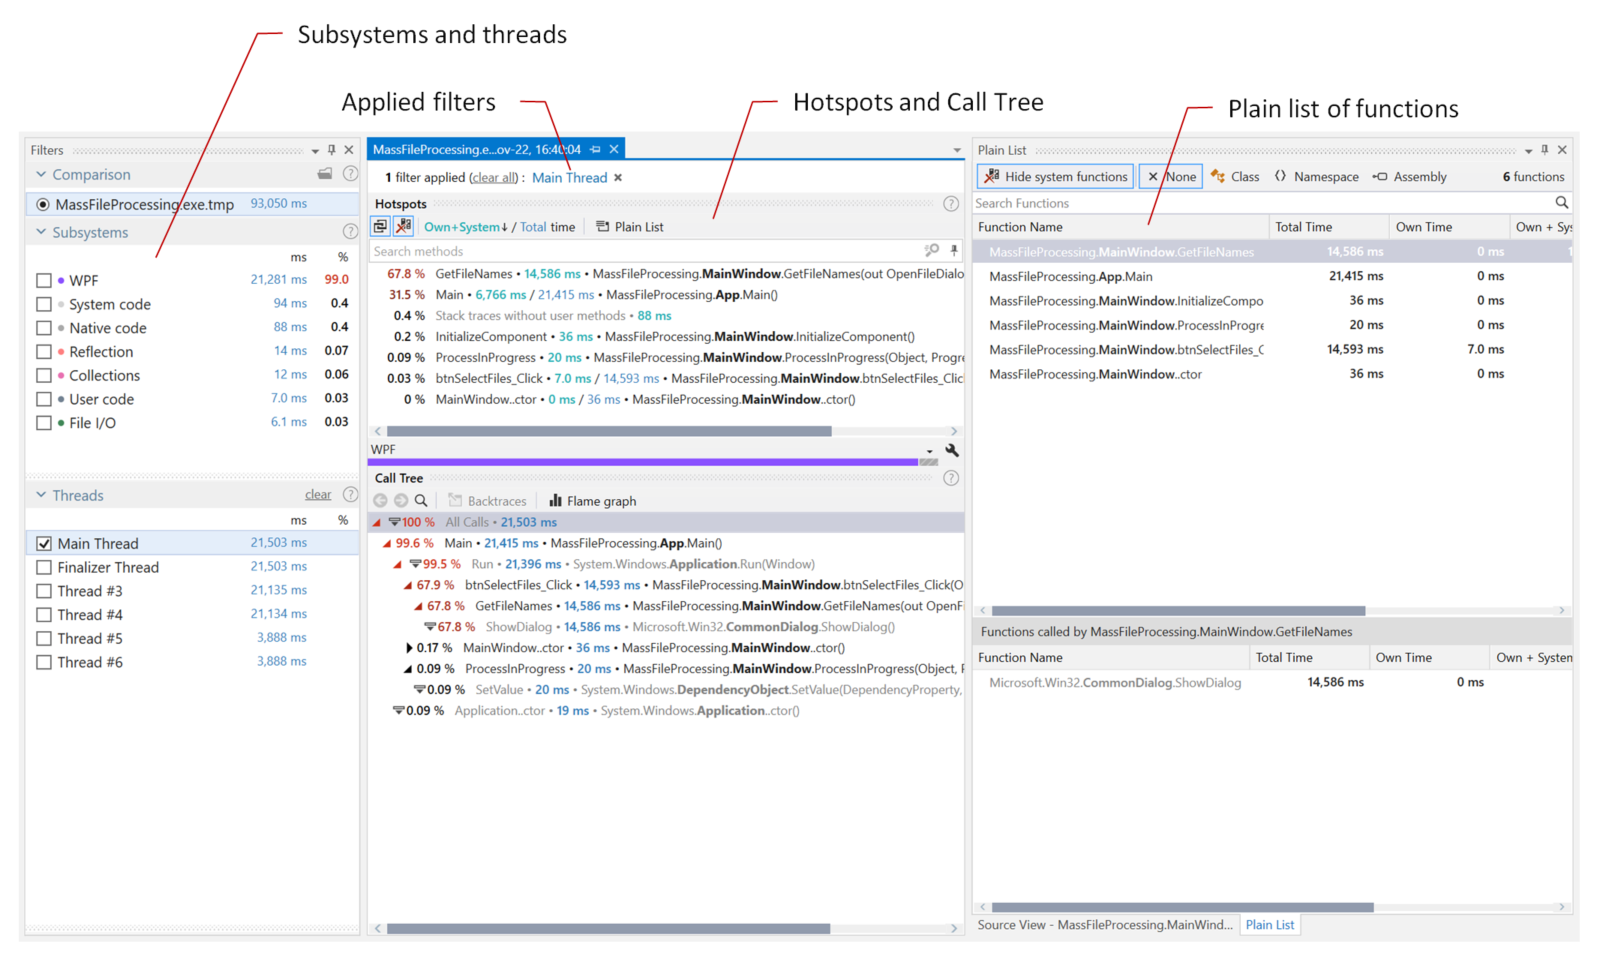
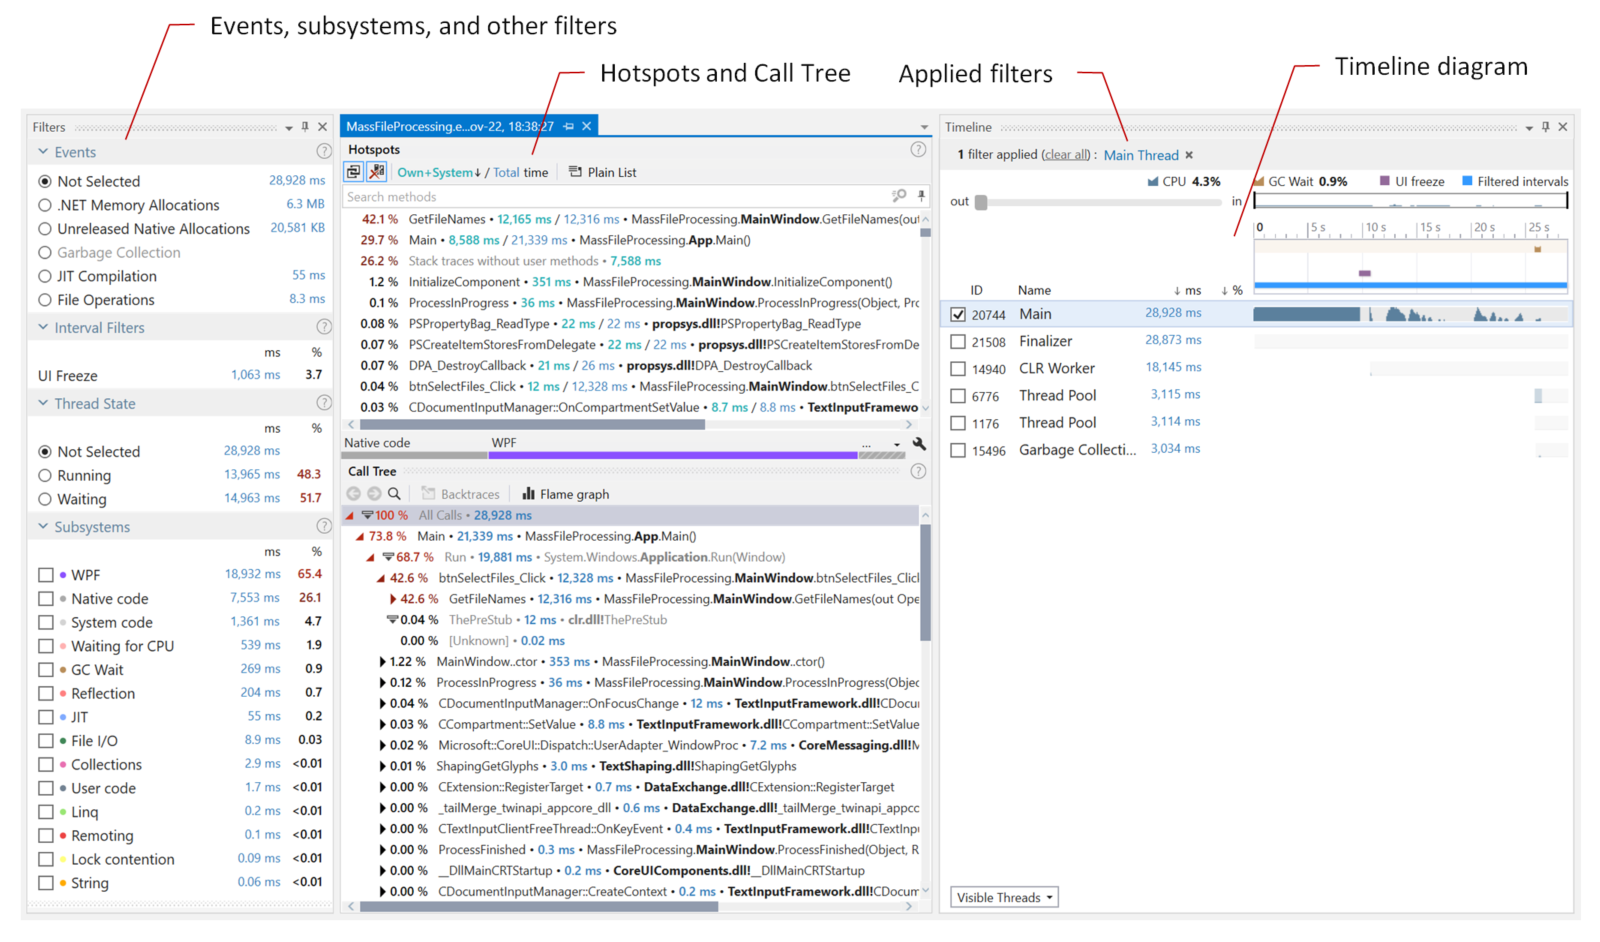
The images below show a sampling and a timeline snapshot of the same application opened in dotTrace Viewer:
Sampling

The following tool windows and filters aren't available for Sampling, tracing, and line-by-line snapshots: the Timeline diagram; Events, Interval Filters, Thread State, filters; Events, SQL Queries, Incoming HTTP Requests, File I/O tool windows, and some other UI elements.
Timeline

As you can see, the timeline snapshot contains more data: the data about memory allocation, file operations, UI freezes, and other ETW events. In addition, it shows more subsystems, and unlike the sampling snapshot, you can select any time interval you're interested in on the Timeline diagram.
Analysis workflow
Snapshot analysis in dotTrace Viewer implies that you slice and dice the data using filters – Filters, Timeline/Threads, Call Stack, and others let you apply filters by time, thread, particular method, or other data. The result of filters' work is always a set of time intervals or point events selected by a specific condition. For example, you can ask the viewer to "Select all time intervals where the Main thread is running" or "Select all time intervals where MyMethod() works".
Here we come to a couple of concepts you need to know for successful data analysis in dotTrace Viewer.
- Everything is a filter
Each UI control in dotTrace Viewer is used not only to set a specific filter but also to display a chunk of filtered information.
For example, the Thread State filter not only allows you to apply a filter by thread state but also displays how long selected threads were in particular states.
All current filters are displayed on the main bar of the viewer. You can remove any filter or use the Undo and Redo buttons to navigate through the filter history.

- Filters are chained together
Filters can be grouped in chains. Complex filter combinations allow you to analyze almost any aspect of your app.
For example, if you combine the Select all time intervals where the Main thread is running and Select all time intervals where blocking garbage collection is performed filters, you will get the resulting filter Select all time intervals where the Main thread is running during garbage collections. In other words, this filter combination will leave only the time intervals where the Main thread toggled GCs. The Call Stack | Hotspots filter will show you the exact methods that toggled collections.
Analyze snapshot in different tabs
You can perform a number of analyses of the same snapshot at a time. You can keep one set of filters in one tab and explore the same snapshot with different filters in another.

To open the snapshot in a new tab without filters, click ![]() in the tab header.
in the tab header.
To copy the current analysis to a new tab, use the Ctrl+T combination or the Clone tab context menu item.
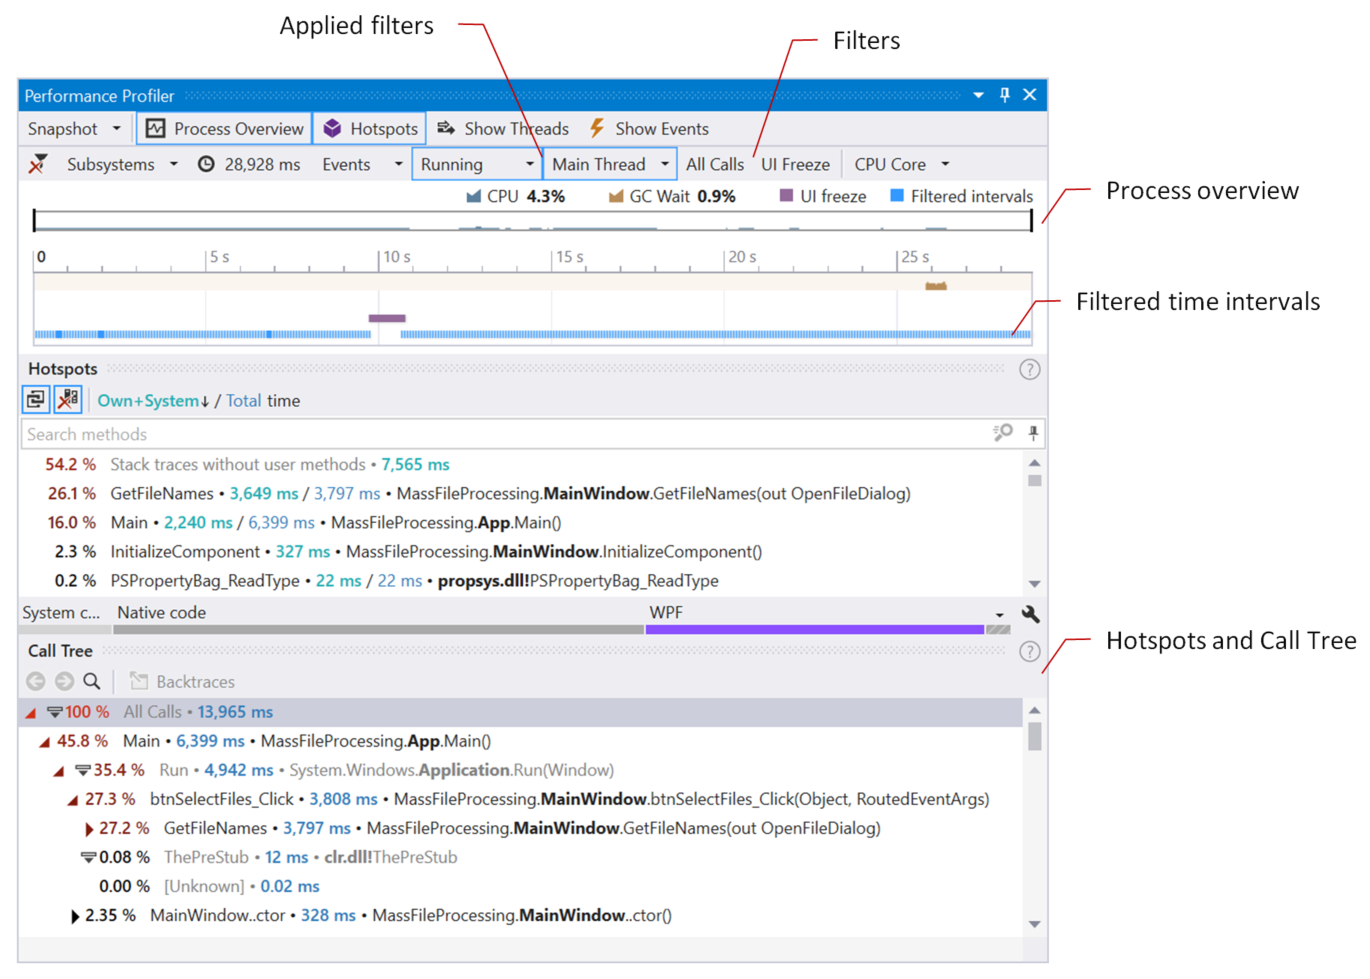
dotTrace Viewer integrated in Visual Studio
If, when installing dotTrace you choose the Visual Studio Integration option, your Visual Studio will get the built-in dotTrace profiler. It is represented with the Performance Profiler tool window (). The integrated dotTrace is a counterpart of the standalone dotTrace Viewer tailored for use within Visual Studio. The user interface of both tools is almost identical. The list of collected snapshots is synced between all dotTrace instances on your machine.

Pros and cons of using the integrated viewer:
More seamless experience. As analysis is performed in Visual Studio, there is no need to switch between the source code and the profiler.
Navigation from the call tree to the source code and vice versa.*
You can navigate from a particular method in Call Tree (in the profiling results) right to its declaration, as well as from the method declaration in the code to its occurrence in Call Tree.
Analyzing big amounts of profiling data in Visual Studio may be inconvenient due to the lack of space on the screen.