Code Inspection
Code analysis basics
PyCharm features robust, fast, and flexible static code analysis. It detects the language and runtime errors, suggests corrections and improvements .
PyCharm performs code analysis by applying inspections to your code. Numerous code inspections exist for Python and for the other supported languages.
The inspections detect not only compiling errors, but also different code inefficiencies. Whenever you have some unreachable code, unused code, non-localized string, unresolved method, memory leaks or even spelling problems – you'll find it very quickly.
PyCharm's code analysis is flexibly configurable. You can enable/disable each code inspection and change its severity, create profiles with custom sets of inspections, apply inspections differently in different scopes, suppress inspections in specific pieces of code, and more.
The analysis can be performed in several ways:
- By default, PyCharm analyses all open files and highlights all detected code issues right in the editor. On the right side of the editor you can see the analysis status of the whole file (the icon in the top-right corner).
When an error is detected, this icon is
 ; in case of a warning, it is
  ; if everything is correct, the icon is
  .
. - Alternatively, you can run code analysis in a bulk mode for the specified scope, which can be as large as the whole project.
- If necessary, you can apply a single code inspection in a specific scope.
For the majority of the detected code issues, PyCharm provides quick fix suggestions. You can quickly review errors in a file by navigating from one highlighted line to another by pressing F2Shift+F2.
For more information and procedural descriptions, see Configuring Inspection Severities.
Inspection profiles
When you inspect your code, you can tell PyCharm which types of problems you would like to search for and get reports about. Such configurations can be preserved as inspection profiles.
An inspection profile defines the types of problems to be sought for, i.e. which code inspections are enabled/disabled and the severity of these inspections. Profiles are configurable in the Inspections settings page.
To set the current inspection profile (the one that is used for the on-the-fly code analysis in the editor), simply select it in the Inspections settings page and apply changes. When you perform code analysis or execute a single inspection, you can specify which profile to use for each run.
Inspection profiles can be applicable for the entire IDE or for a specific project:
- Project profiles are shared and accessible for the team members via VCS. They are stored in the project directory:
<project>/.idea/inspectionProfiles. - IDE profiles are intended for personal use only and are stored locally in XML files under the
USER_HOME/.<PyCharm version>/config/inspectiondirectory.
PyCharm comes with the following pre-defined inspection profiles:
- Default: This local (IDE level) profile is intended for personal use, applies to all projects, and is stored locally in the
Default.xmlfile under theUSER_HOME/.<PyCharm version>/config/inspectiondirectory. - Project Default: when a new project is created, the Project Default profile is copied from the settings of a template project. This profile is shared and applies to the current project.
After a project is created, any modifications to the project default profile will pass unnoticed to any other projects.
When the settings of the Project Default profile are modified in the Template Project settings, the changed profile will apply to all newly created projects, but the existing projects will not be affected as they already have a copy of this profile.
Project Default profile is stored in theProject_Default.xmlfile located in the<project>/.idea/inspectionProfilesdirectory.
One can have as many inspection profiles as required. There are two ways of creating new profiles: you can add a new profile as a copy of the Project Default profile or copy the currently selected profile. The newly created profiles are stored in XML files, located depending on the type of the base profile.
The <profile_name>.xml files representing inspection profiles appear whenever some changes to the profiles are done and applied. The files only store differences against the default profile.
Refer to the section Customizing Profiles for details.
Synchronizing profiles between computers
If an inspection profile is made project-specific, it is synchronized with your project automatically. Each user, who opens this project after checking it out, will have the same inspection profile enabled.
If an IDE Default inspection profile is used, it can be synchronized between multiple machines via the Settings Repository plugin, bundled with PyCharm. So doing, the file is stored in USER_HOME/.<PyCharm version>/config/inspection/<profile_name>.xml.
Note that the Global profile may have a different name. Copy your current project profile to the Global Level (click the button Manage and choose Copy as Global) and call it as you like.
Then, on the main menu, choose and select this global profile as the default one for all the new projects. Now all the newly-created projects will use this global profile by default and this global profile will be synchronized between the various machines via the Settings Repository plugin.
Inspection severity
Inspection severity indicates how seriously the code issues detected by the inspection impact the project and determines how the detected issues should be highlighted in the editor. By default, each inspection has one of the following severity levels:
- Server problem

- Typo

- Info

- Weak Warning

- Warning

- Error

You can increase or decrease the severity level of each inspection. That is, you can force PyCharm to display some warnings as errors or weak warnings. In a similar way, what is initially considered a weak warning can be displayed as a warning or error, or just as info.
You can also configure the color and font style used to highlight each severity level. Besides, you can create custom severity levels and set them for specific inspections.
If necessary, you can set different severity levels for the same inspection in different scopes.
All modifications to inspections mentioned above are saved in the inspection profile currently selected in the inspection settings and apply when this profile is used.
Inspection scope
By default, all enabled code inspections apply to all project files. If necessary, you can configure each code inspection (enable/disable, change its severity level and options) individually for different scopes. Such configurations, like any other inspection settings, are saved and applied as part of a specific profile.
There may be complicated cases when an inspection has different configurations associated with different scopes. When such inspection is executed in a file belonging to some or all of these scopes, the settings of the highest priority scope-specific configuration are applied. The priorities are defined by the relative position of the inspection's scope-specific configuration in inspection settings: the uppermost configuration has the highest priority. The Everywhere else configuration always has the lowest priority.
For more information and procedural descriptions, see Configuring Inspection for Different Scopes.
Examples of code inspections
In the Inspections page, all inspections are grouped into categories. The most common tasks covered by code analysis are:
- Locating dead code.
- Detecting performance issues.
- Improving code structure and maintainability.
- Conforming to coding guidelines and standards.
- Conforming to specifications.
Locating dead code
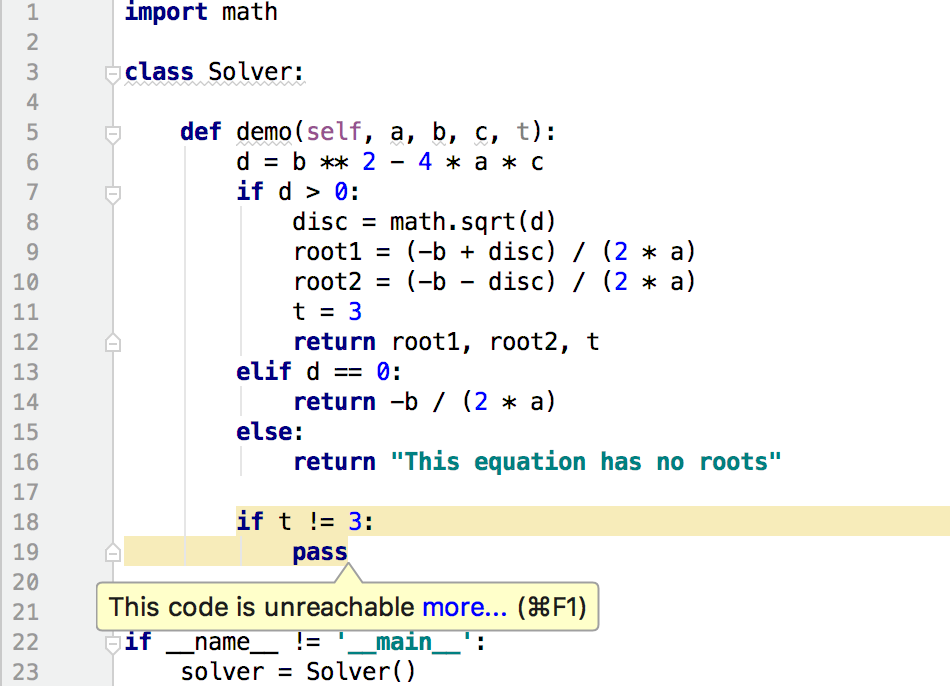
PyCharm highlights in the editor pieces of so-called dead code. This is the code that is never executed during the application runtime. Perhaps, you don't even need this part of code in your project. Depending on situation, such code may be treated as a bug or as a redundancy. Anyway it decreases the application performance and complicates the maintenance process. Here is an example. 
Highlighting unused declarations
PyCharm is also able to instantly highlight unused local variables via Unused declarations inspection. By default, PyCharm highlights all unused local variables ignoring the following:
- Variables used in tuple unpacking
- Lambda parameters
- Range iteration variables
If you want to be notified on any of the these types, open the Editor | Inspection in project Settings/Preferences, choose Unused local under the Python node, and deselect the corresponding checkboxes in Options. The following example illustrates a code inspection warning for the unused variable in tuple unpacking.

Unresolved references
This inspection enables detecting unresolved references, and highlights them with the red curvy line. PyCharm intention actions suggest quick fixes for the unresolved references in the source code. See Resolving References for more details.
Python inspection examples
Find descriptions and examples of the various code inspections in the Inspections page of the Settings dialog. In this section, we'll consider several most prominent examples. In particular, PyCharm reports
- Code incompatible with the current Python interpreter version:

Note that you can change the scope of versions in the inspection settings.
- Unresolved references:

- Duplicate keys in dictionaries:

- Dead code:

- Unused variables:

