Creating and Running Your First Python Project
In this section:
- Before you start
- Creating a simple Python project in PyCharm
- Exploring and configuring project structure
- Creating a Python class
- Editing source code
- Running application
- Run/debug configuration
- Debugging application
Before you start
Make sure that the following prerequisites are met:
- You are working with PyCharm version 4.0.0 or higher. If you still do not have PyCharm, download it from this page. To install PyCharm, follow the instructions, depending on your platform.
- You have at least one Python interpreter properly installed on your computer. You can download an interpreter from this page.
Creating a simple Python project in PyCharm
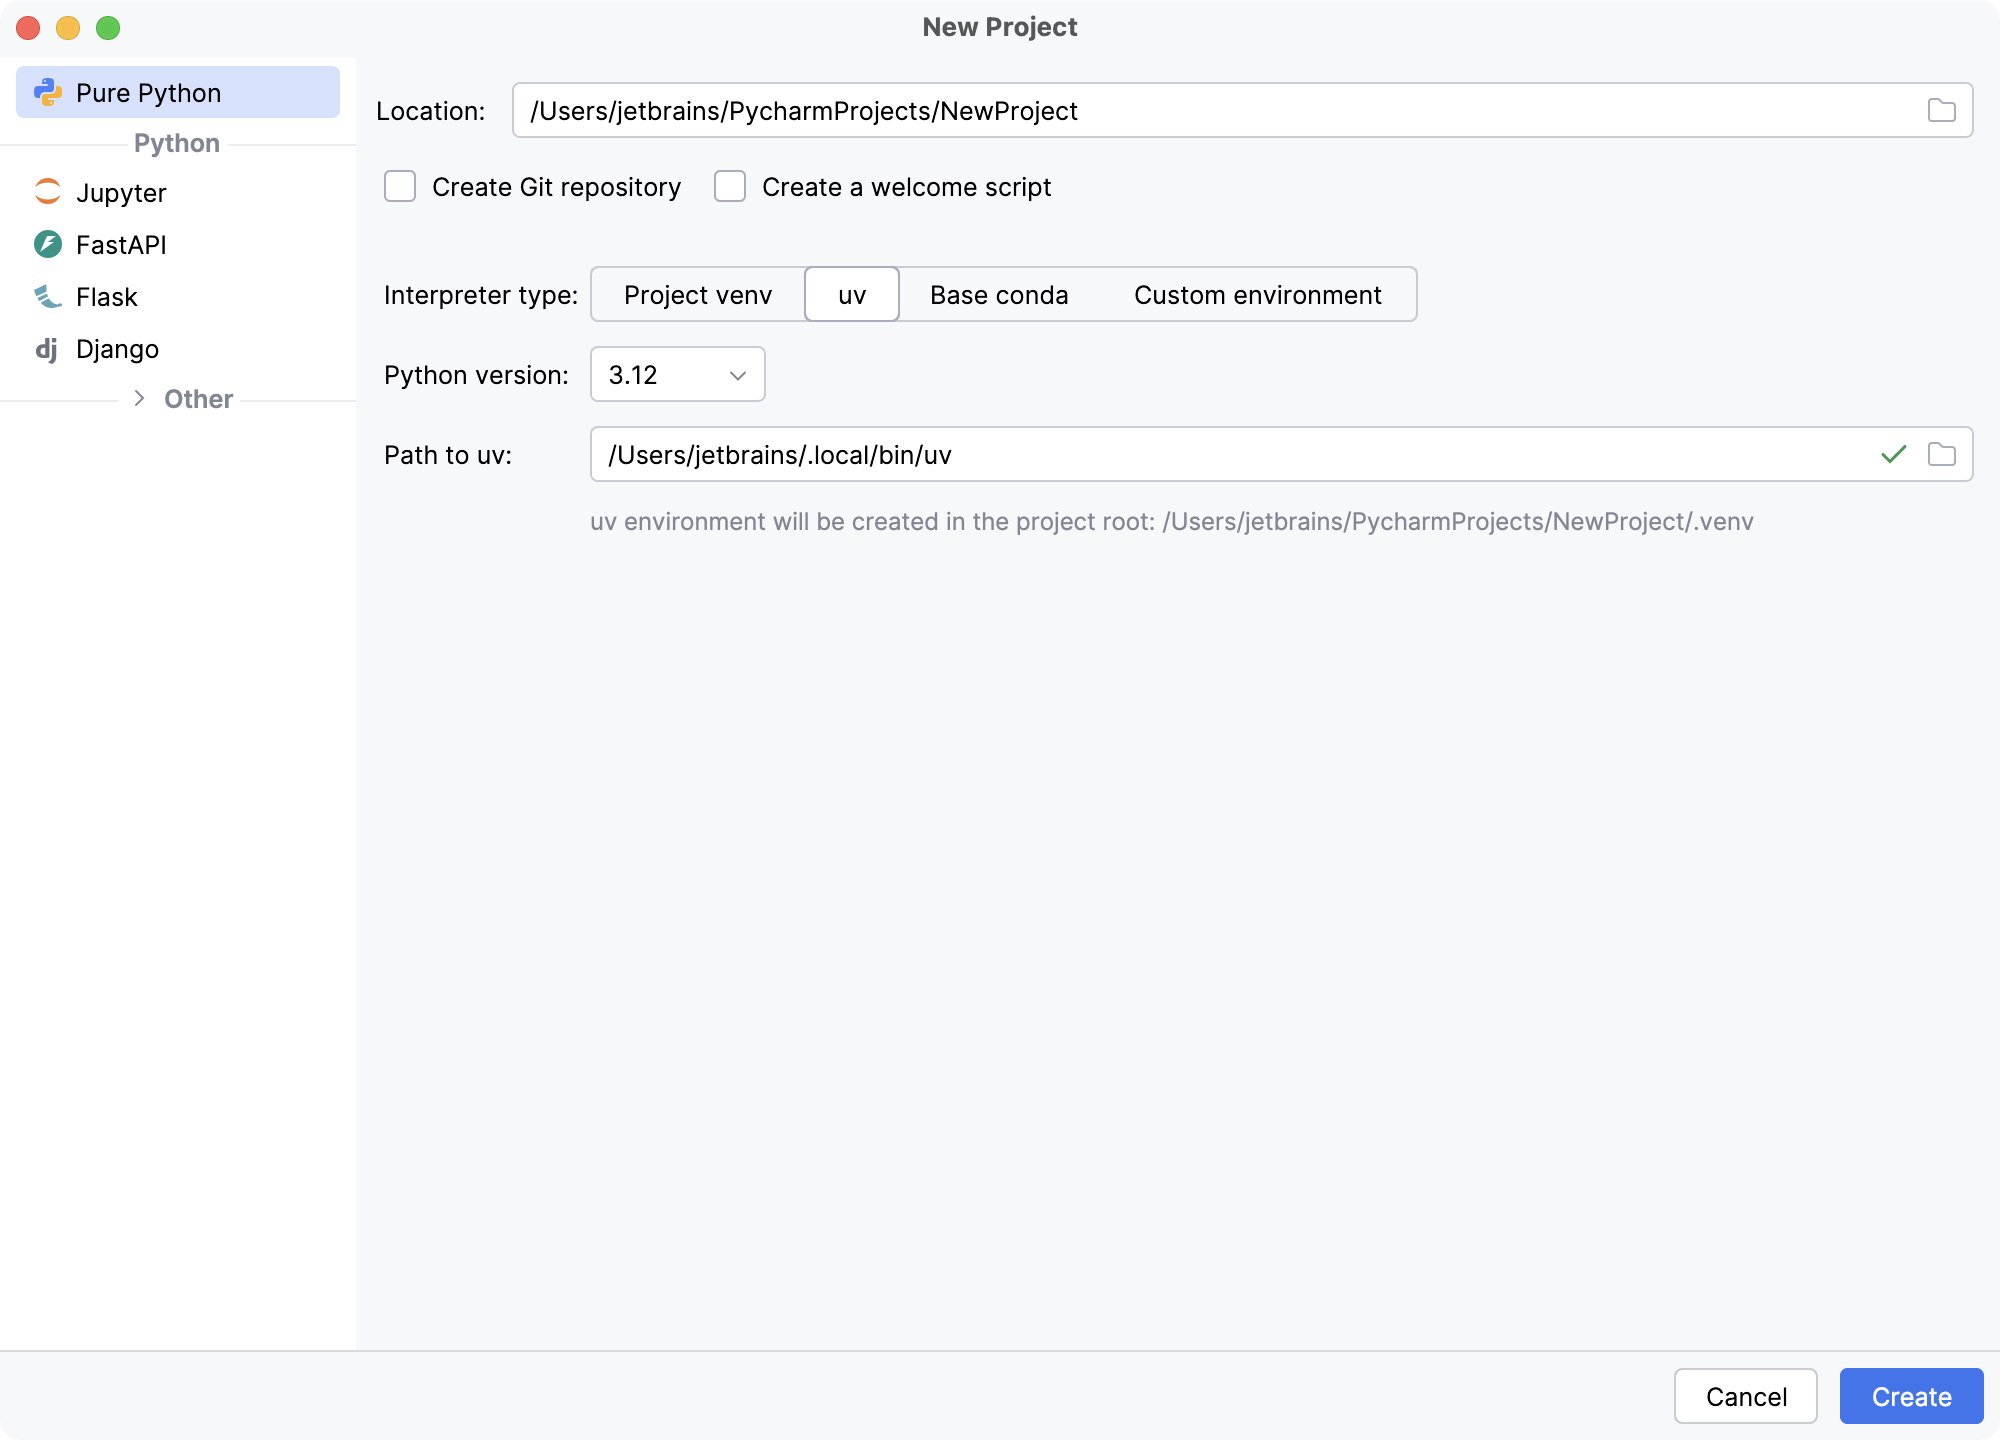
You can create a new project in a number of ways: from the Welcome screen (link Create New Project), or from the main menu ( ). In both cases, the Create New Project wizard opens. Refer to the section Creating Projects from Scratch in PyCharm.
Note that PyCharm suggests several project templates for the development of the various types of applications (Django, Google AppEngine, etc.). When PyCharm creates a new project from a project template, it produces the corresponding directory structure and specific files.
However, our task here is to create a project for Python. In this case let's select the type Pure Python
- it is most suitable for plain Python programming. In this case PyCharm will not produce any special files or directories except for
the directory named .idea
(refer to the section Project and IDE Settings for details).
Choose the project location. To do that, click the browse button next to the Location field, and
specify the directory for your project.
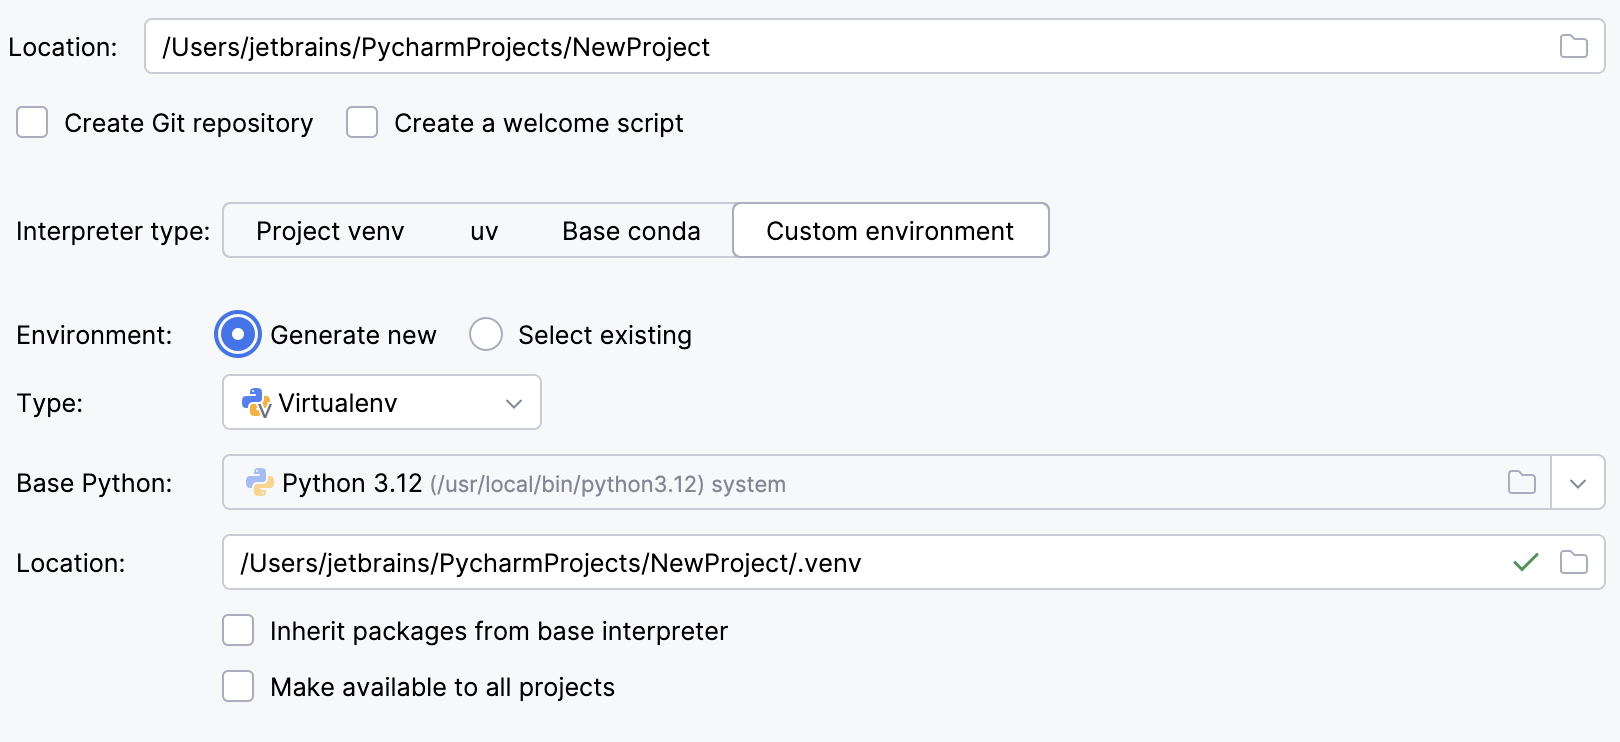
Let's choose a Python interpreter. Since you have at least one Python interpreter at your disposal, let's define it as the project interpreter.
To do that, either click the drop-down list and choose one of the interpreters
already installed on your machine, or click ,
choose Add Local, and then select the desired interpreter from your file system.
Here the local interpreter is Python 3.4.1.

Exploring and configuring project structure
Let's explore the initial project structure in the Project tool window:

As you see, the project contains just the project root, and, under the External Libraries node, the Python interpreter you've specified on project creation.
Let's configure the project structure: press Ctrl+Alt+S to show the Settings/Preferences dialog, expand the node Project: MyPythonApp, and then select the Project Structure page:

Under the project root you see .idea
directory - it contains MyPythonApp.iml
file that reflects the project structure, and several XML files, each one responsible for its own set of settings,
which can be recognized by their names: encodings.xml
, vcs.xml
etc.
Note that .idea
directory is not visible in the Project view of the Project tool window.
Next let's add a source root, where all the work will actually be performed. In the same Project Structure page, right-click the project root, and choose on the context menu:

In the dialog box that opens, type the folder name (here it is src
):

Finally, let's mark this directory as the source root: select src
directory, and
click - you see that
src
directory is now marked with icon:

Click OK to apply changes and close the Settings/Preferences dialog.
Actually, this step is optional. You can just create a file under the project root, and it will be perceived as the source, since by default the project root is the source root.
Creating a Python class
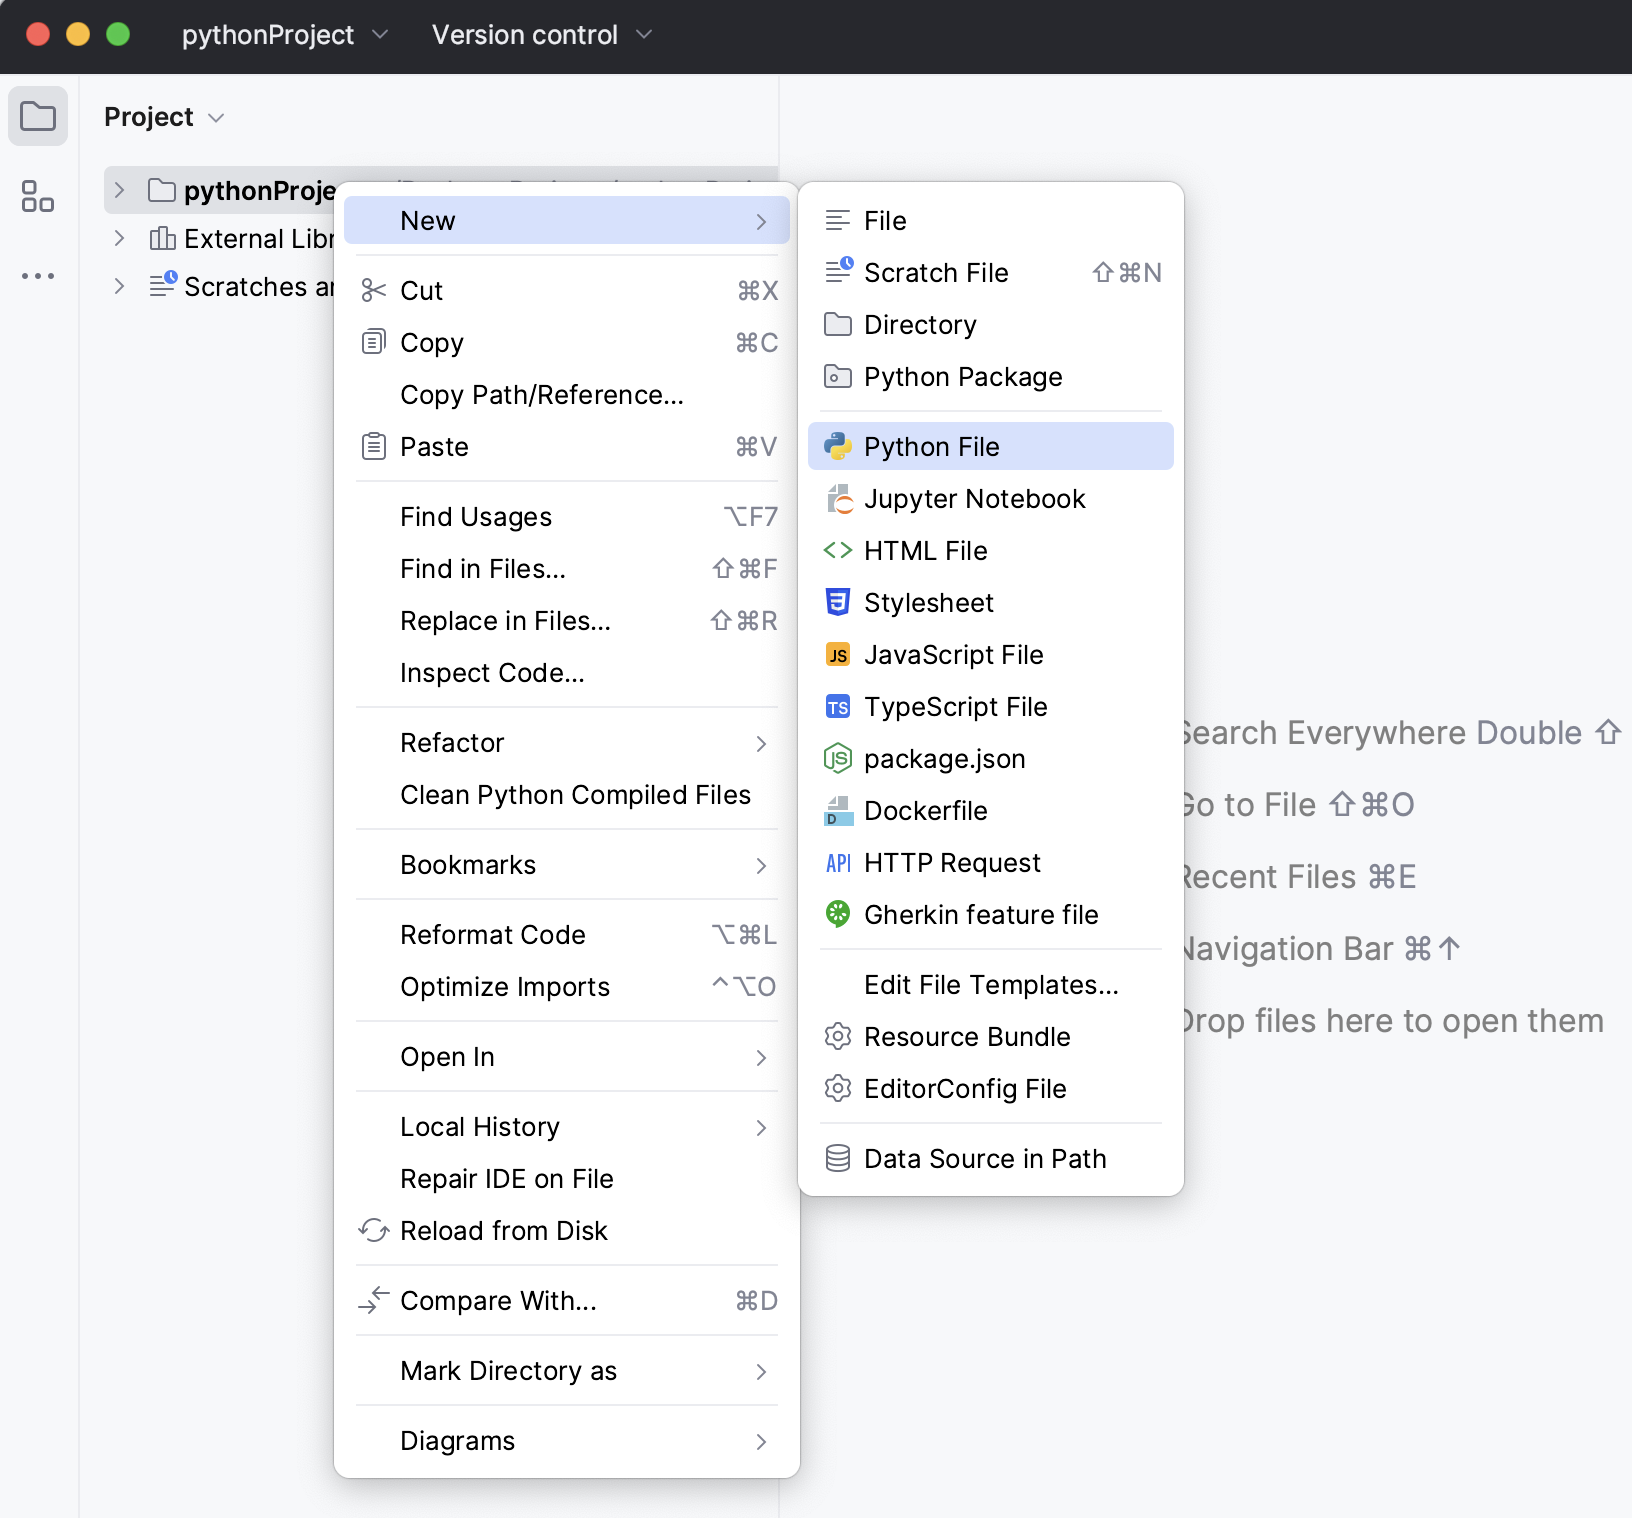
Select src
directory in the Project tool window, and press Alt+Insert:

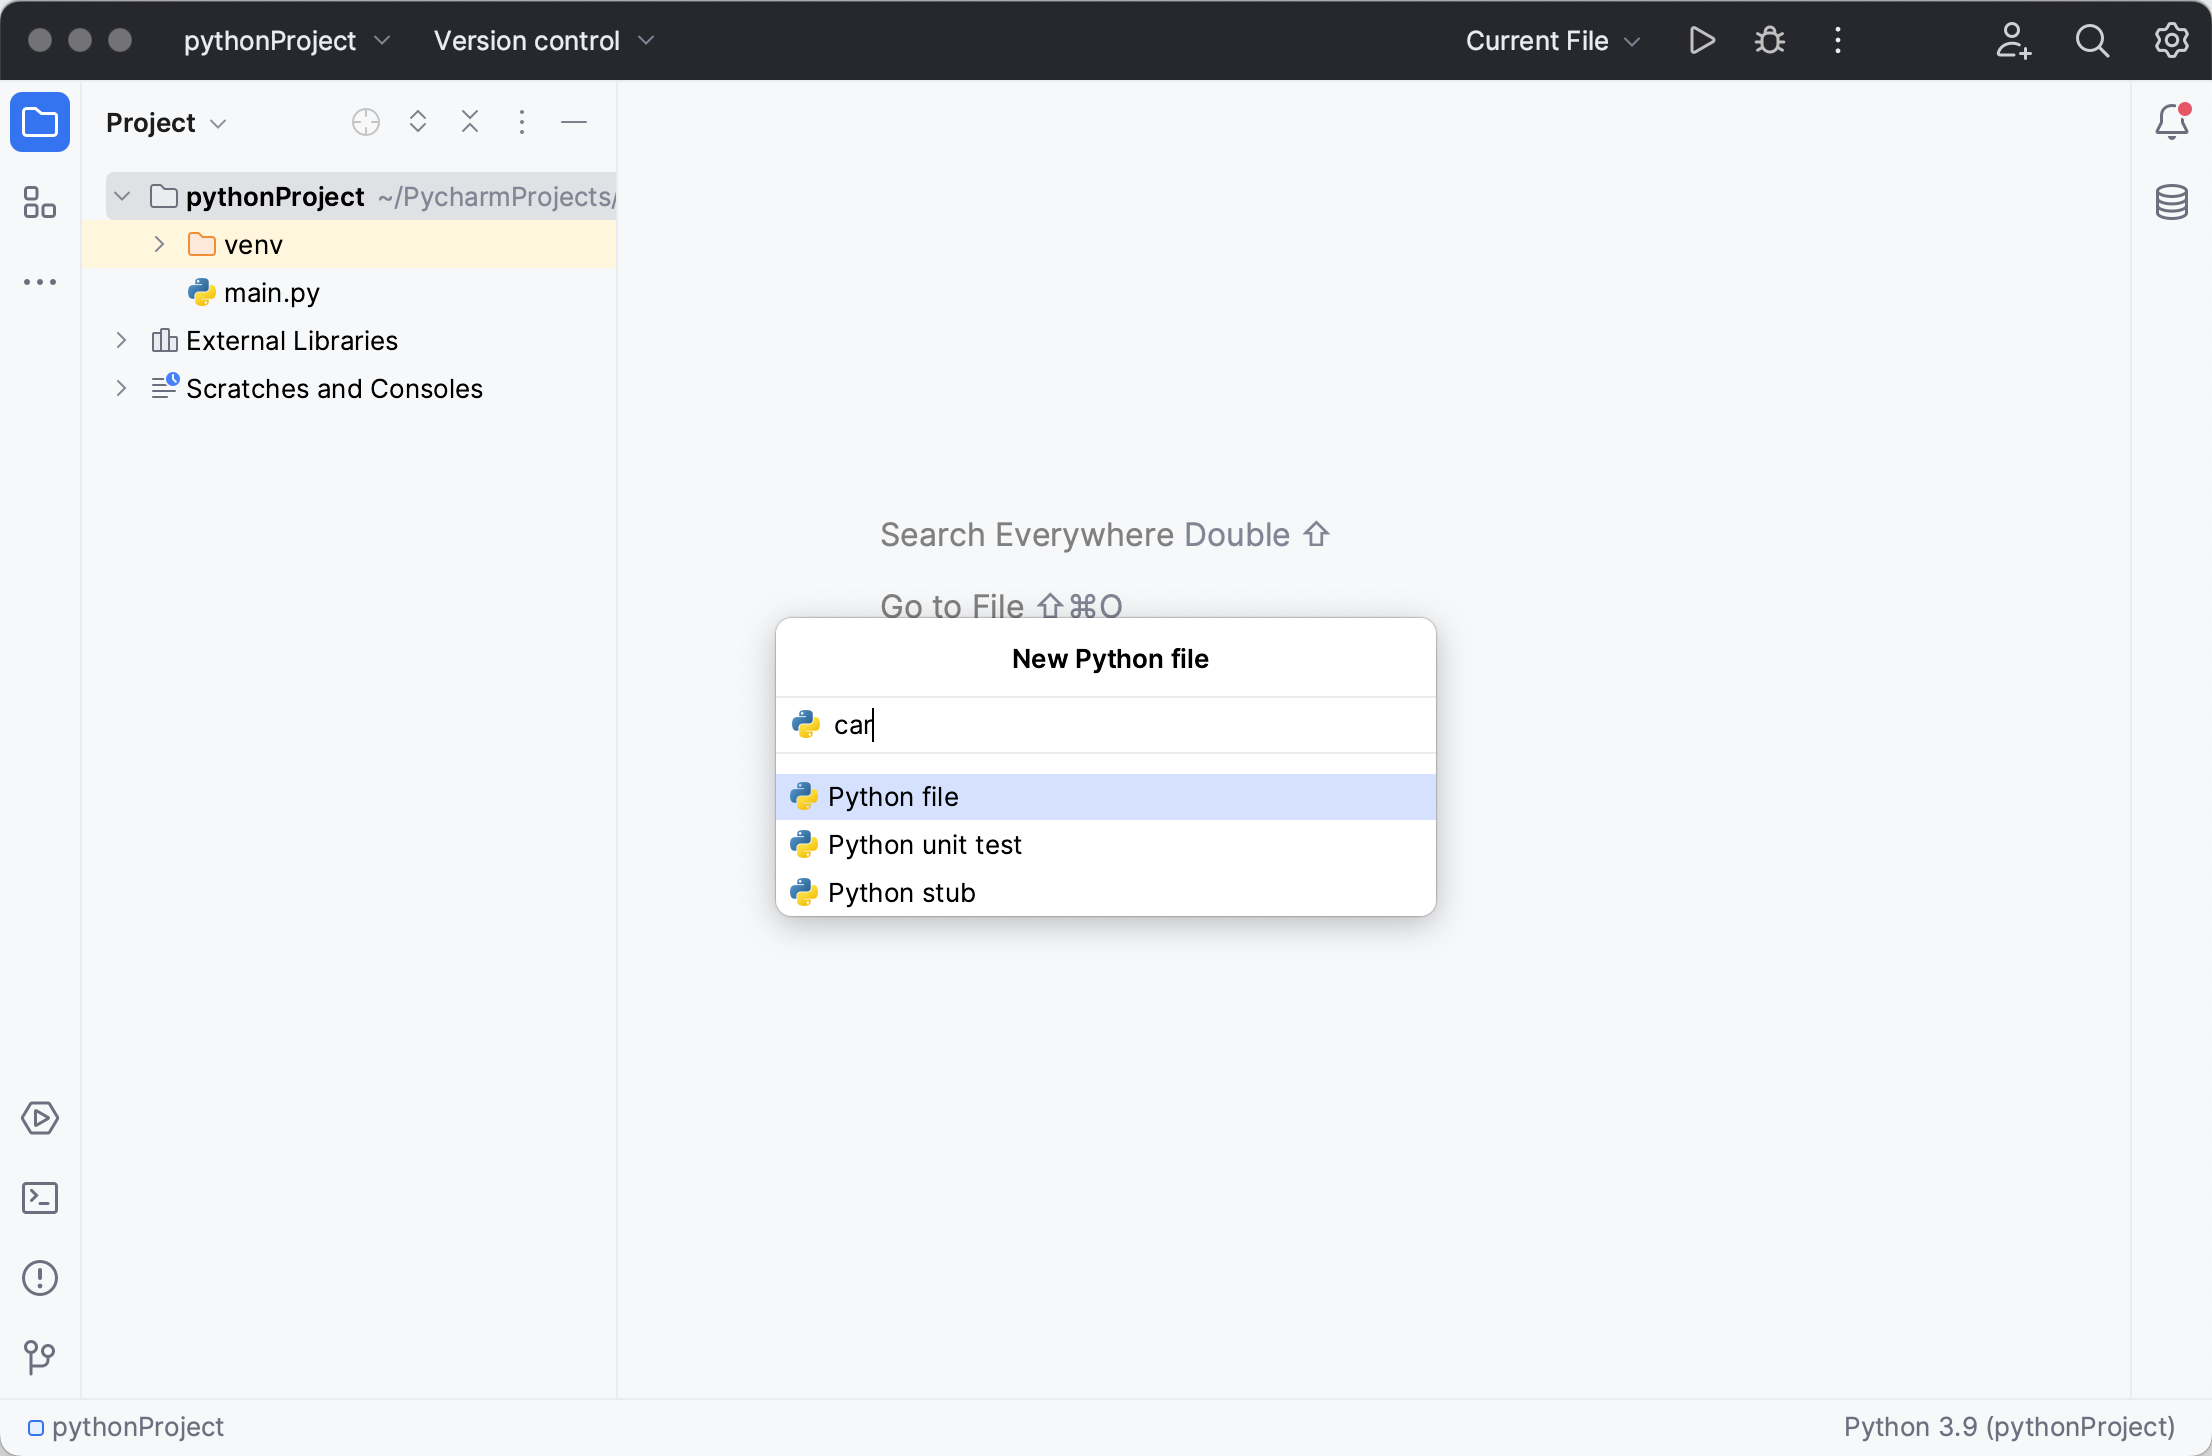
Choose the option Python file from the pop-up window, and then type the new file name (Solver
).
PyCharm creates a new Python file and opens it for editing:

Editing source code
Let us first have a look at the Python file we've just generated. The stub contains just a single line:
_author_ = 'wombat'
The explanation is simple: since a Python file is produced by a file template,
PyCharm has substituted the actual value instead of the pre-defined variable
$USER
.
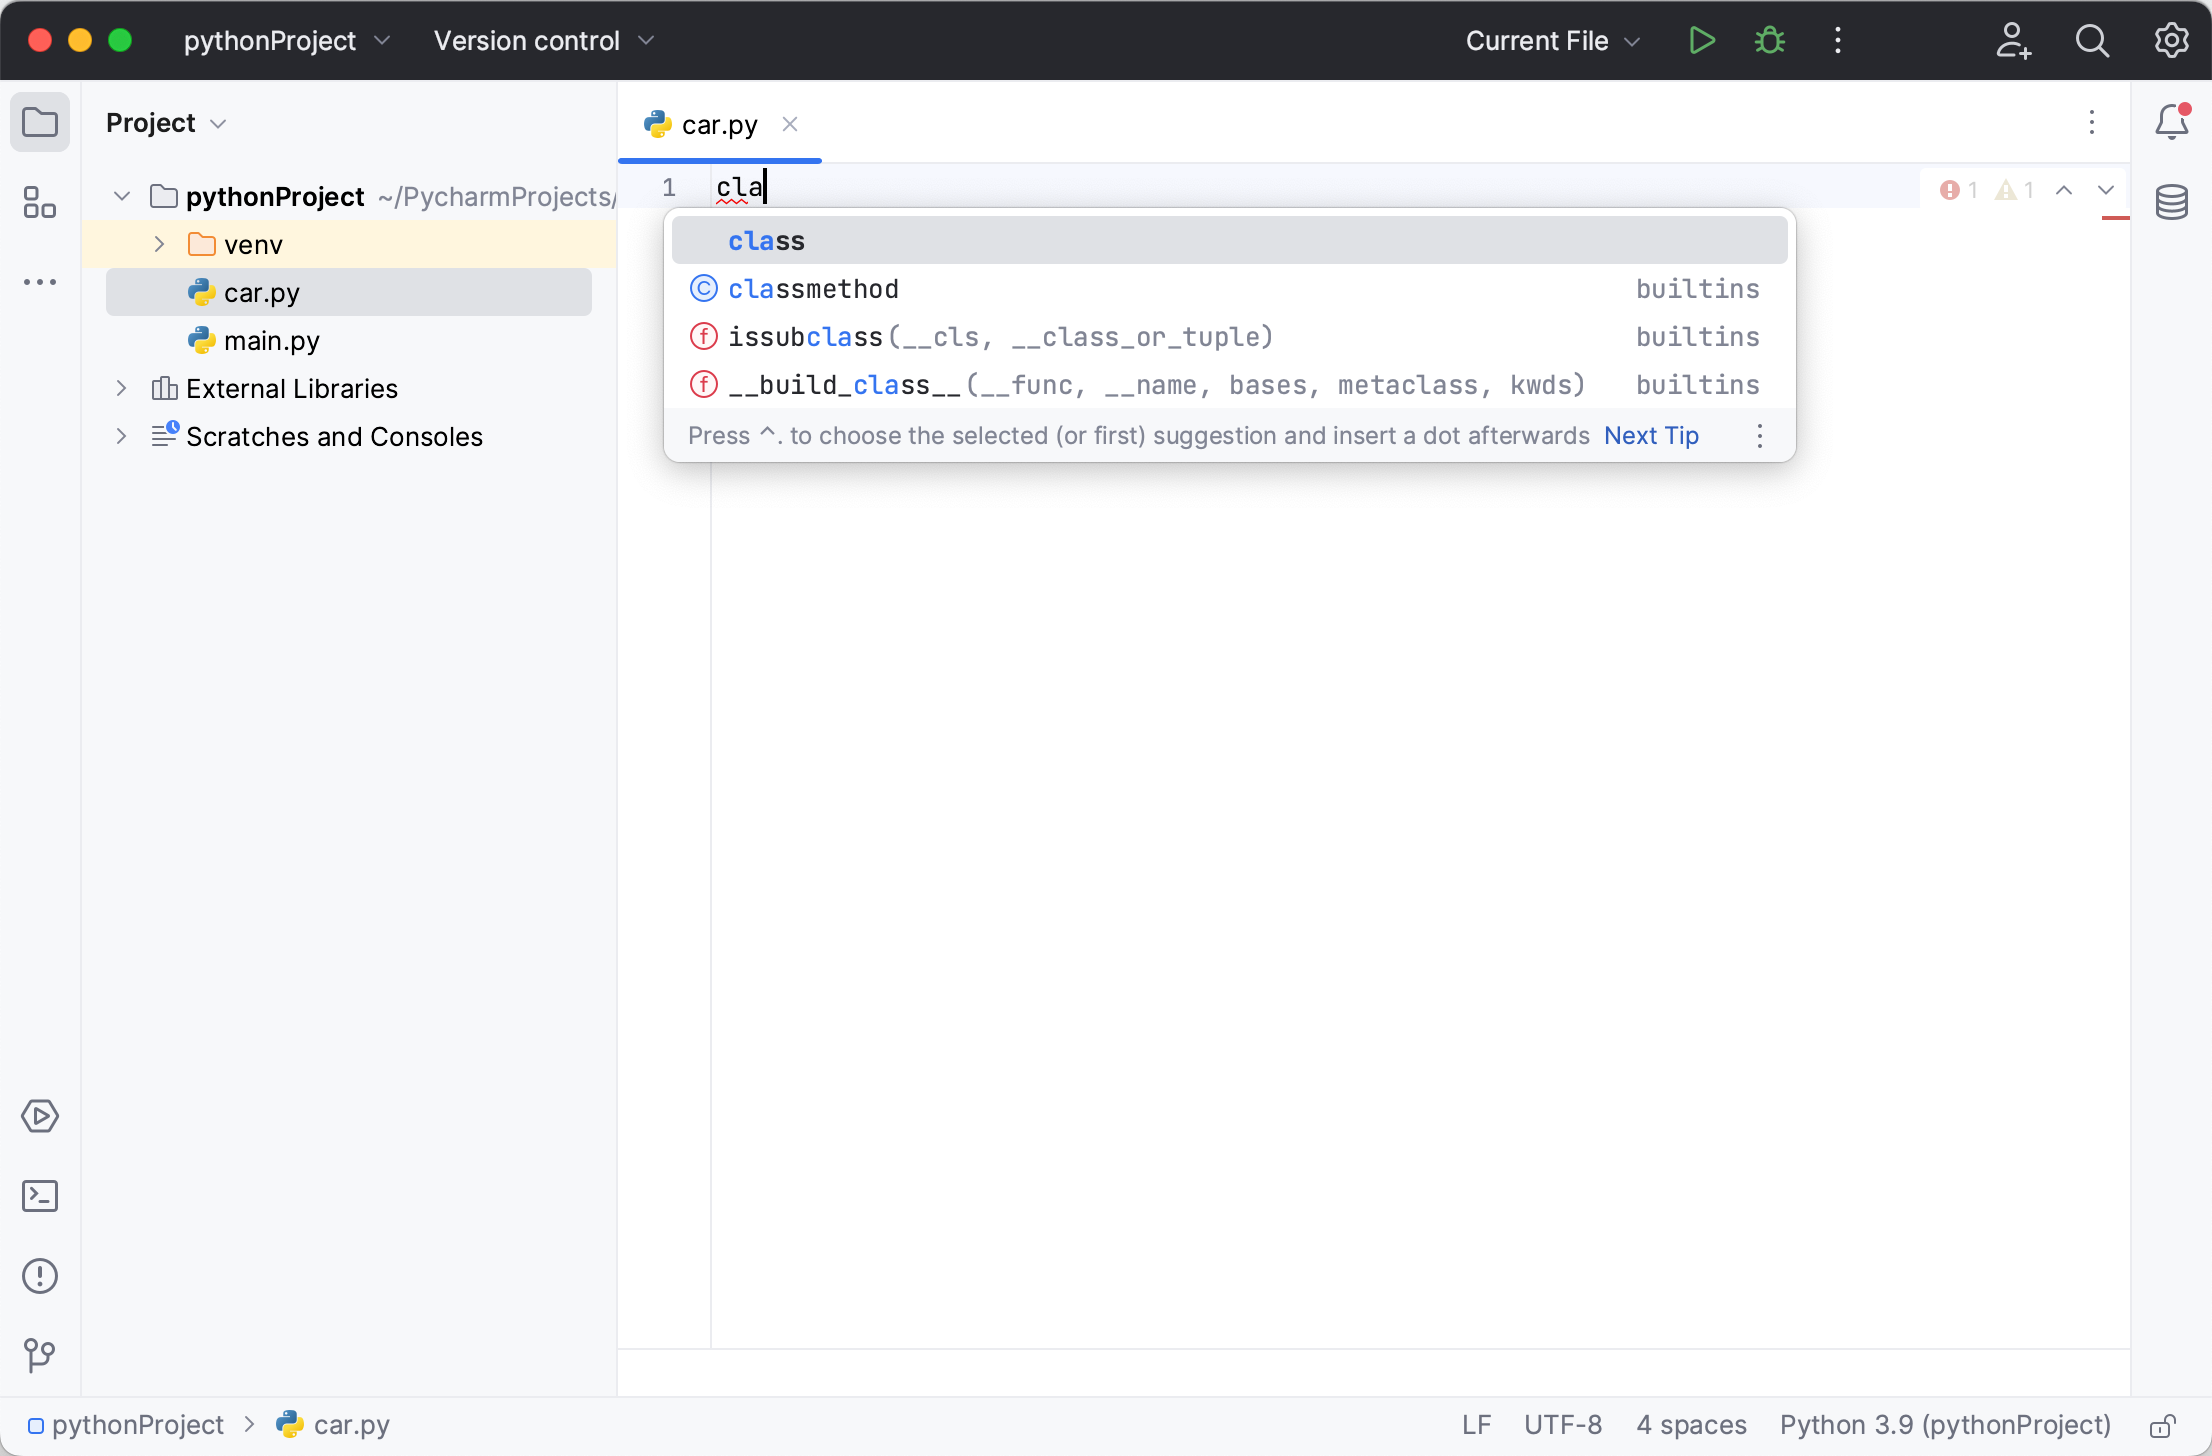
Immediately as you start typing, you understand that PyCharm, like a pair-programmer, looks over your shoulder and suggests proper choices. For example, you want to create a Python class. As you just start typing the keyword, a suggestion list appears:

Choose the keyword class
and type the class name (Solver
).
PyCharm immediately informs you about the missing colon, then expected indentation:

Note the error stripes in the right gutter. Hover your mouse pointer over an error stripe, and PyCharm shows a balloon with the detailed explanation. Since PyCharm analyses your code on-the-fly, the results are immediately shown in the inspection indicator on top of the right gutter.
This inspection indication works like a traffic light: when it is green, everything is OK, and you can go on with your code; a yellow light means some minor problems that however will not affect compilation; but when the light is red, it means that you have some serious errors.
Let's continue creating the function demo
: when you just type the opening brace,
PyCharm creates the entire code construct (mandatory parameter self
, closing brace and colon),
and provides proper indentation:

Note as you type, that unused symbols are greyed out:

As soon as you calculate a discriminant, they are rendered as usual. Next, pay attention to the unresolved reference math
.
PyCharm underlines it with the red curvy line, and shows the red bulb.
Let's make a brief excursus into PyCharm's notion of intention actions and quick fixes. When you write your code, it is sometimes advisable to modify code constructs - in this case PyCharm shows a yellow light bulb. However, if PyCharm encounters an error, it shows the red light bulb.
In either case, to see what does PyCharm suggest you to do, press Alt+Enter - this will display the suggestion list, which in our case contains several possible solutions:

Let's choose importing the math
library. Import statement is added to the Solver.py
file.
Next, calculate roots of the quadratic equation, and print them out, and finally, let's call the function demo
of the class Solver
:
import math
_author_ = 'wombat'
class Solver:
def demo(self):
a = int(input("a "))
b = int(input("b "))
c = int(input("c "))
d = b ** 2 - 4 * a * c
disc = math.sqrt(d)
root1 = (-b + disc) / (2 * a)
root2 = (-b - disc) / (2 * a)
print(root1, root2)
Solver().demo()
Next, right-click the editor, and on the context menu choose to run the script (Ctrl+Shift+F10).
A console appears in the Run tool window. In this console, you have to enter the a
,
b
and c
values, and expect to see a result.
Oops... PyCharm reports a run-time error:

It seems that some analysis is advisable, so let's make sure that the radicand d
is non-negative, and report an error, when it is negative. To do that, select the discriminant calculation
statements, and then press Ctrl+Alt+T ( ):

PyCharm creates a stub if
construct, leaving you with the task of filling it with the proper contents.
Finally, it would be nice to have the whole calculation repeated more than once, so let's use the Surround with
action again: select the entire body of the function demo
and surround it with while
.
You'll end up with the code like the following:
import math
_author_ = 'wombat'
class Solver:
def demo(self):
while True:
a = int(input("a "))
b = int(input("b "))
c = int(input("c "))
d = b ** 2 - 4 * a * c
if d>=0:
disc = math.sqrt(d)
root1 = (-b + disc) / (2 * a)
root2 = (-b - disc) / (2 * a)
print(root1, root2)
else:
print('error')
Solver().demo()
Next, let's run and debug this script.
Running application
You have already launched the Solver
script with the keyboard shortcut, so let's
just remind how it's done. PyCharm suggests several ways to run a script opened in the editor:
- First, you can use the keyboard shortcut Ctrl+Shift+F10
- Second, you can use the context menu command (here ), invoked by right-clicking the editor background:
- Use the main menu ,
- Finally, it is possible to run a script from the main toolbar, using the temporary run/debug configuration
Solver
(the notion of a run/debug configuration will be considered in more detail in the next section):
In either case, PyCharm opens Run tool window, and shows the application input and output:

Run/debug configuration
Each script is executed using a special profile, or a run/debug configuration. Such a profile is used for both running and debugging applications, and specifies the script name, working directory, actions to be performed before launch, etc.
PyCharm suggests a number of default run/debug configurations for the various types of applications (Python scripts, Django applications, tests, etc.) You can view the available defaults in the Run/Debug Configurations dialog, which is invoked in numerous ways, for example, by or commands on the main menu, or by clicking the drop-down list in the Run area of the main toolbar:

Let's look at the Edit Configurations dialog more attentively. Its left-hand part contains a tree view with two top-level nodes: Python and Default:

The lower node contains the list of default run/debug configurations. These default run/debug configurations are nameless, but each new run/debug configuration is created on the grounds of a default one, and gets the name of your choice.
The upper node is called Python and contains just one run/debug configuration Solver
,
which is shown grayed out. What does it mean?
Run/debug configuration Solver
is a temporary profile, which PyCharm has produced,
when you've just run the Solver
script. It resides under the node Python,
since this run/debug configuration is created on the base of the default configuration of the Python type.
You can save this run/debug configuration and thus make it permanent. Permanent run/debug configurations are rendered in a normal font. Unlike temporary configurations, the number of permanent ones is unlimited.
Let's use the same temporary run/debug configuration Solver
for debugging the Solver
script.
Debugging application
What will you do to execute your application step by step, examine program information related to variables, watches, or threads, find out the origin of exceptions? This is where the debugging comes to help.
To start debugging, you have to set breakpoints first. To create a breakpoint, just click the left gutter:

Next, right-click the editor background, and choose on the context menu. PyCharm starts the debugging session and shows the Debug tool window. The following image corresponds to the default layout of panes and tabs:

The Debug tool window shows dedicated panes for frames, variables, and watches, and the console, where all the input and output information is displayed. If you want the console to be always visible, just drag it to the desired place.
Use the stepping toolbar buttons to step through your application:

As you step through the application, each reached breakpoint becomes blue:

Pay attention to the values that appear next to the variables in the editor: this is the so-called inline debugging. This feature is enabled in the Debug tool window: