Docker
Docker is a tool for deploying and running executables in isolated and reproducible environments. This may be useful, for example, to test code in an environment identical to production.
PyCharm integrates the Docker functionality and provides assistance for creating Docker images, running Docker containers, managing Docker Compose applications, using public and private Docker registries, and much more directly from the IDE.
You can run and debug your Python code in various environments deployed in Docker containers. For more information, refer to Configure an interpreter using Docker.
Enable the Docker plugin
This functionality relies on the Docker plugin, which is bundled and enabled in PyCharm by default. If the relevant features are not available, make sure that you did not disable the plugin.
Press Ctrl+Alt+S to open settings and then select .
Open the Installed tab, find the Docker plugin, and select the checkbox next to the plugin name.
Install and run Docker
Install and run Docker as described in Docker documentation.
Connect to the Docker daemon
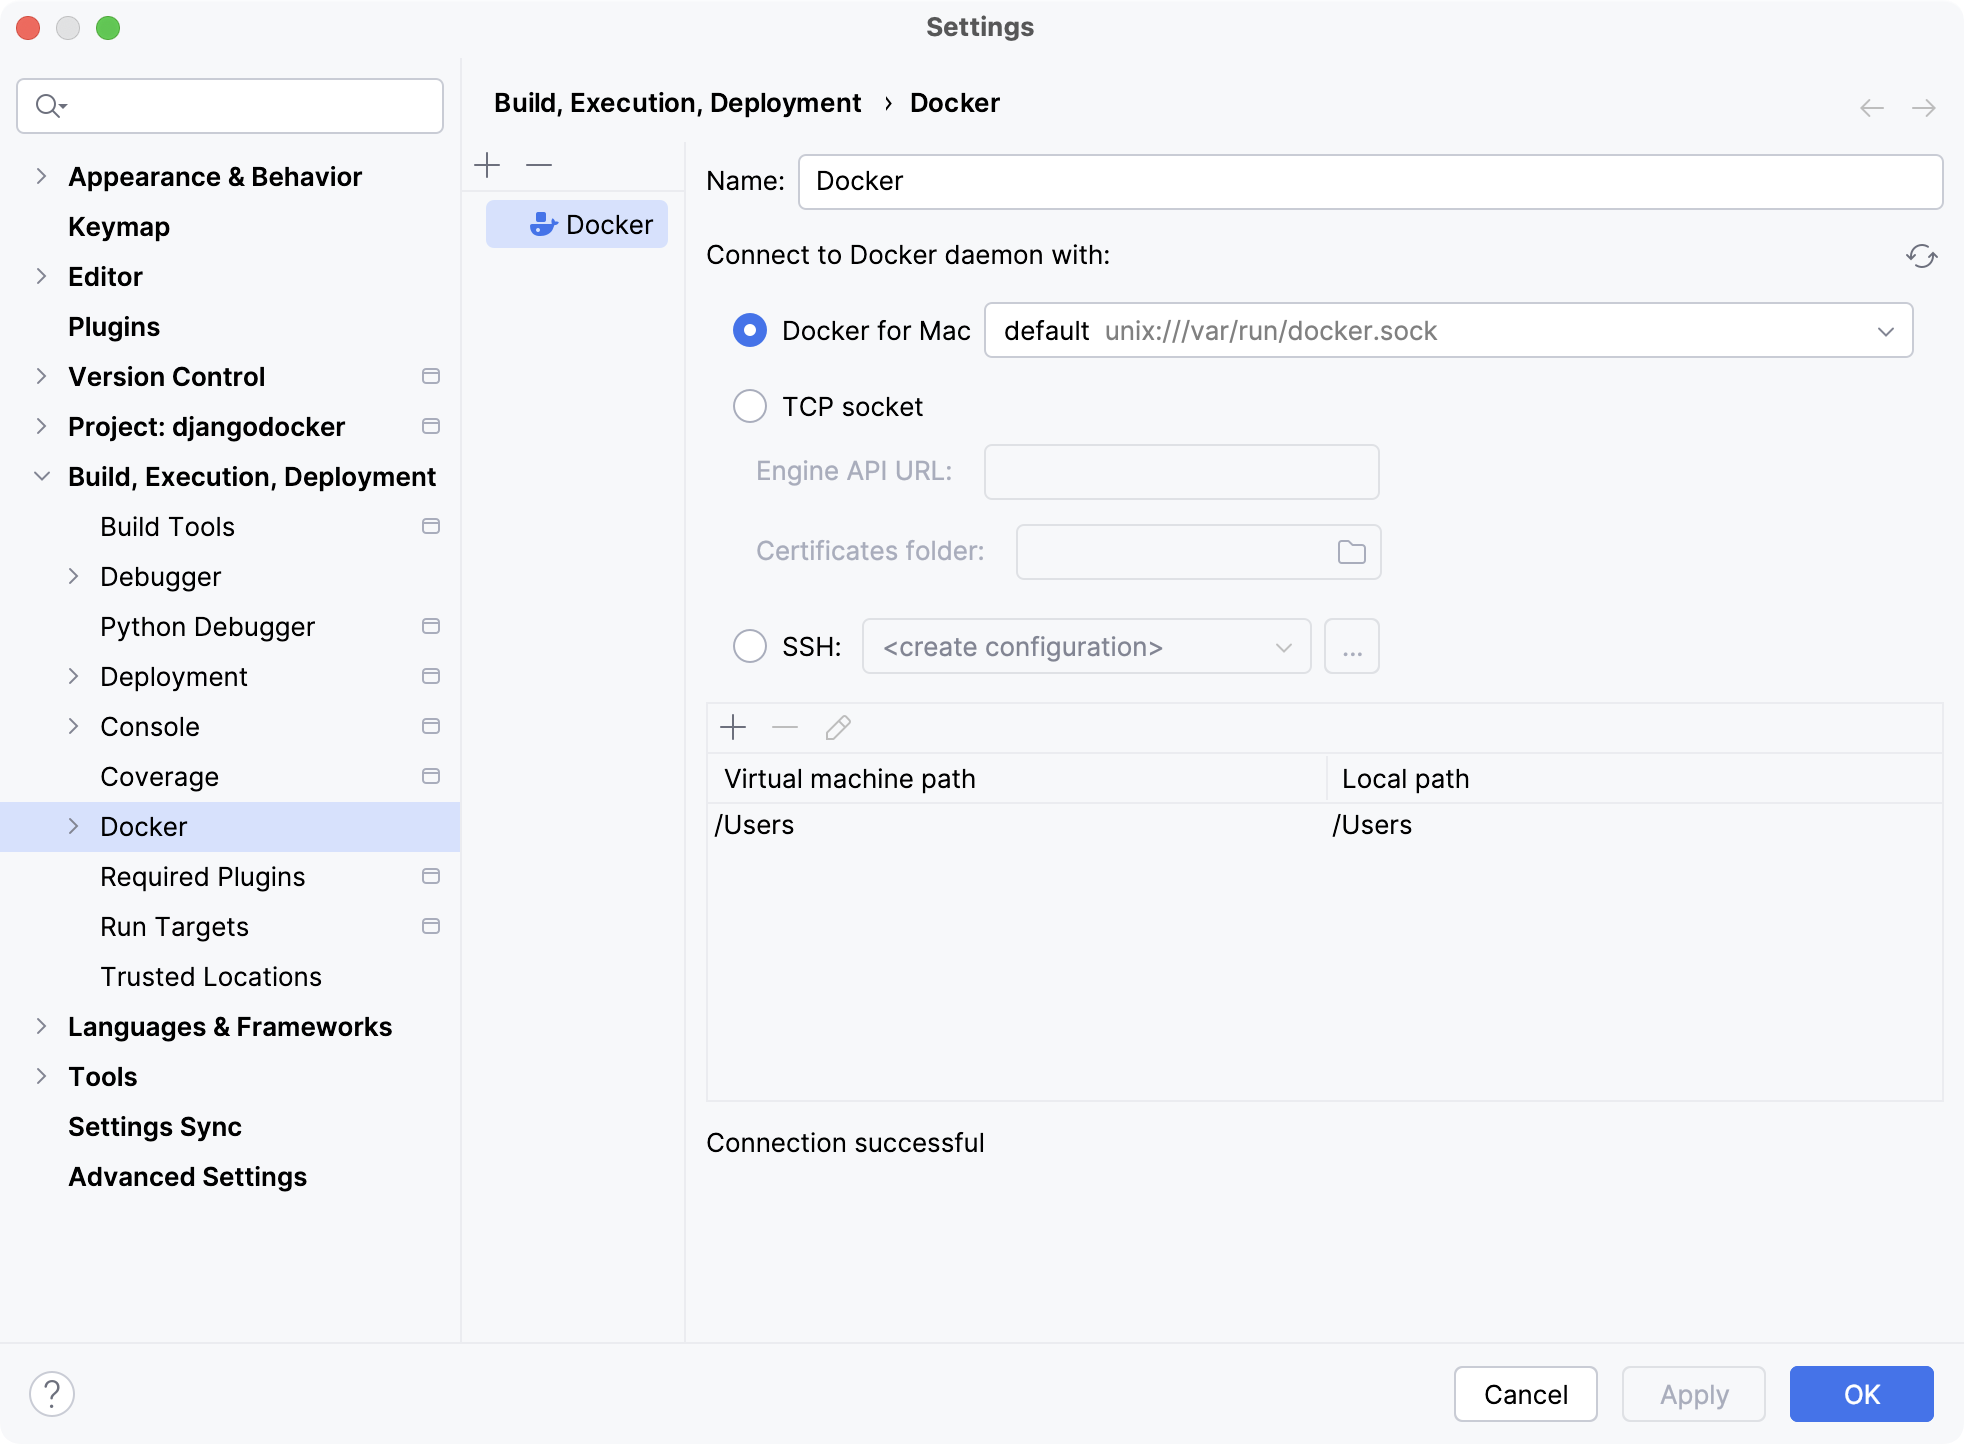
Press Ctrl+Alt+S to open settings and then select .
Click
to add a Docker configuration and specify how to connect to the Docker daemon.
The connection settings depend on your Docker version and operating system. For more information, refer to Docker connection settings.
The Connection successful message should appear at the bottom of the dialog.

For more information about mapping local paths to the virtual machine running the Docker daemon when using Docker on Windows or macOS, refer to Virtual machine path mappings for Windows and macOS hosts. You will not be able to use volumes and bind mounts for directories outside of the mapped local path.
This table is not available on a Linux host, where Docker runs natively and you can mount any directory to the container.
Open the Services tool window ( or Alt+8), select the configured Docker connection node
and click
, or select Connect from the context menu.

To edit the Docker connection settings, select the Docker node and click
on the toolbar, or select Edit Configuration from the context menu.
You can also click
and select Docker Connection to add a Docker connection directly from the Services tool window. If you have Docker contexts configured, you can select Docker Connections from Docker Contexts to add the corresponding connections.
Once you connect to the Docker daemon, you can use the Services tool window ( or Alt+8) to manage everything related to Docker, for example: pull and push images, create and run containers, and scale Docker Compose services. As with other tool windows, you can start typing the name of an image or container to highlight the matching items.

For more information, refer to the section about Docker in Services tool window.
Prerequisites for working with Docker on a remote server
Before you start working with Docker on a remote machine, make sure the following prerequisites are met:
A local Docker CLI, which is necessary for connecting to the remote Docker instance. You can either install Docker Desktop or just Docker CLI.
Docker Buildx plugin, which is necessary for building images from Dockerfile. Note that using Buildx with Docker requires Docker Engine version 19.03 or later.