Add Django templates
Enable the Django plugin
This functionality relies on the Django plugin, which is bundled and enabled in PyCharm by default. If the relevant features are not available, make sure that you did not disable the plugin.
Press Ctrl+Alt+S to open settings and then select .
Open the Installed tab, find the Django plugin, and select the checkbox next to the plugin name.
PyCharm makes it possible to create and render templates written in one of the supported template languages:
It is important to note that one can edit templates without actually installing the template languages. However, in order to create or render templates, and navigate between views and templates, the corresponding template language should be properly installed.
Creating templates
Create a template for a view
Suppose you reference an index.html template file that doesn't yet exist.
index.html is marked as an unresolved reference:

Press Alt+Enter or click
 and choose to create the missing template:
Create Template dialog appears, showing the read-only template name (Template path field), and a list of possible template locations (Templates root field):

Select the template directory, where the new template will be created.
The Templates root field provides a list of possible locations for the new template. This list includes the template directories specified in the page of the IDE settings Ctrl+Alt+S plus all templates folders located inside of app directories, if any.
Click OK.
An empty .html file is created in the specified location
Before making use of a certain template language, configure it in the Template Languages section of the IDE settings Ctrl+Alt+S and ensure that file types of any existing templates are properly recognized.
Configure a template language for a project
Open the IDE settings Ctrl+Alt+S and go to .
From the Template language list, select the specific template language to be used in the project.
In the Template file types area, specify the types of files, where template tags will be recognized.
Note that in HTML, XHTML, and XML files templates are always recognized.
Use Add and Remove buttons to make up the desired list of file types.
To quickly create Django templates, you can use live templates. Live templates let you insert common Django template tags by typing short abbreviations.
Insert a template tag by using a live template
Type the abbreviation of the desired template tag and press Tab.
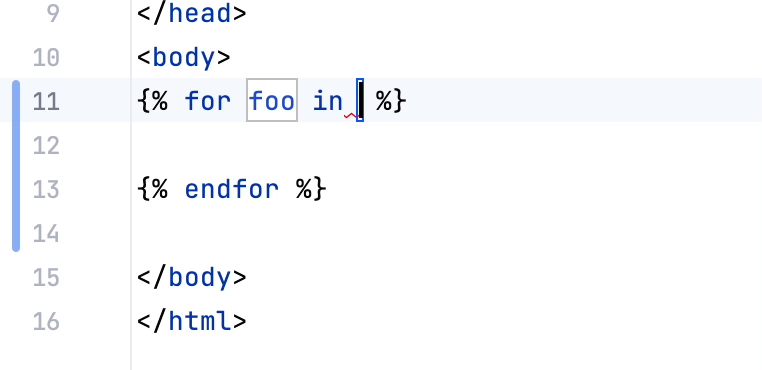
If the live template contains variables, the caret will move to the first one.
Type the value of the variable, then press Tab to jump to the next variable.
Press Shift+Tab if you need to go back to the previous variable.
To see the list of live templates that are available in Django template files, go to and expand the Django node.

You can edit the existing templates, or create a new one as described in Create live templates.
Configuring directories
When creating a Django application, you can immediately specify a folder where templates will be stored.
Define template directories
Open the IDE settings Ctrl+Alt+S, expand the node, and click the Project Structure page.
Choose the directory to be marked as a template root.
Do one of the following:
Click
 Templates on the toolbar of the Content roots pane.
Choose Templates on the directory's context menu.
You can also mark folders as template directories directly in the Project tool window:
Mark a directory as a template folder
In the Project tool window, right-click the desired directory.
From the context menu, choose .
This results in adding the marked directory to the list of template directories in the Project Structure page .
You can make Django skip some folders (disable Django language substitution), if you mark them as resources.
Debugging Django templates
After you create Django templates, you can use PyCharm to debug them.
Set a breakpoint
Add a breakpoint to the template file. To do that, open the file templates/poll/index.html and click the gutter:

Launch a run/debug configuration
Launch the selected run/debug configuration in the debug mode by clicking
 .
.
The PyCharm window appears. You can see that the breakpoint has been hit, and the Debug tool window contains the current values of the variables in the Threads & Variables tab:
