Debug
During a debugging session, you launch your program with the debugger attached to it. The purpose of the debugger is to interfere with the program execution and provide you with the information on what’s happening under the hood. This facilitates the process of detecting and fixing bugs in your program.
If you are new to debugging, try the Debugging with PyCharm tutorials.
Debugger implementations
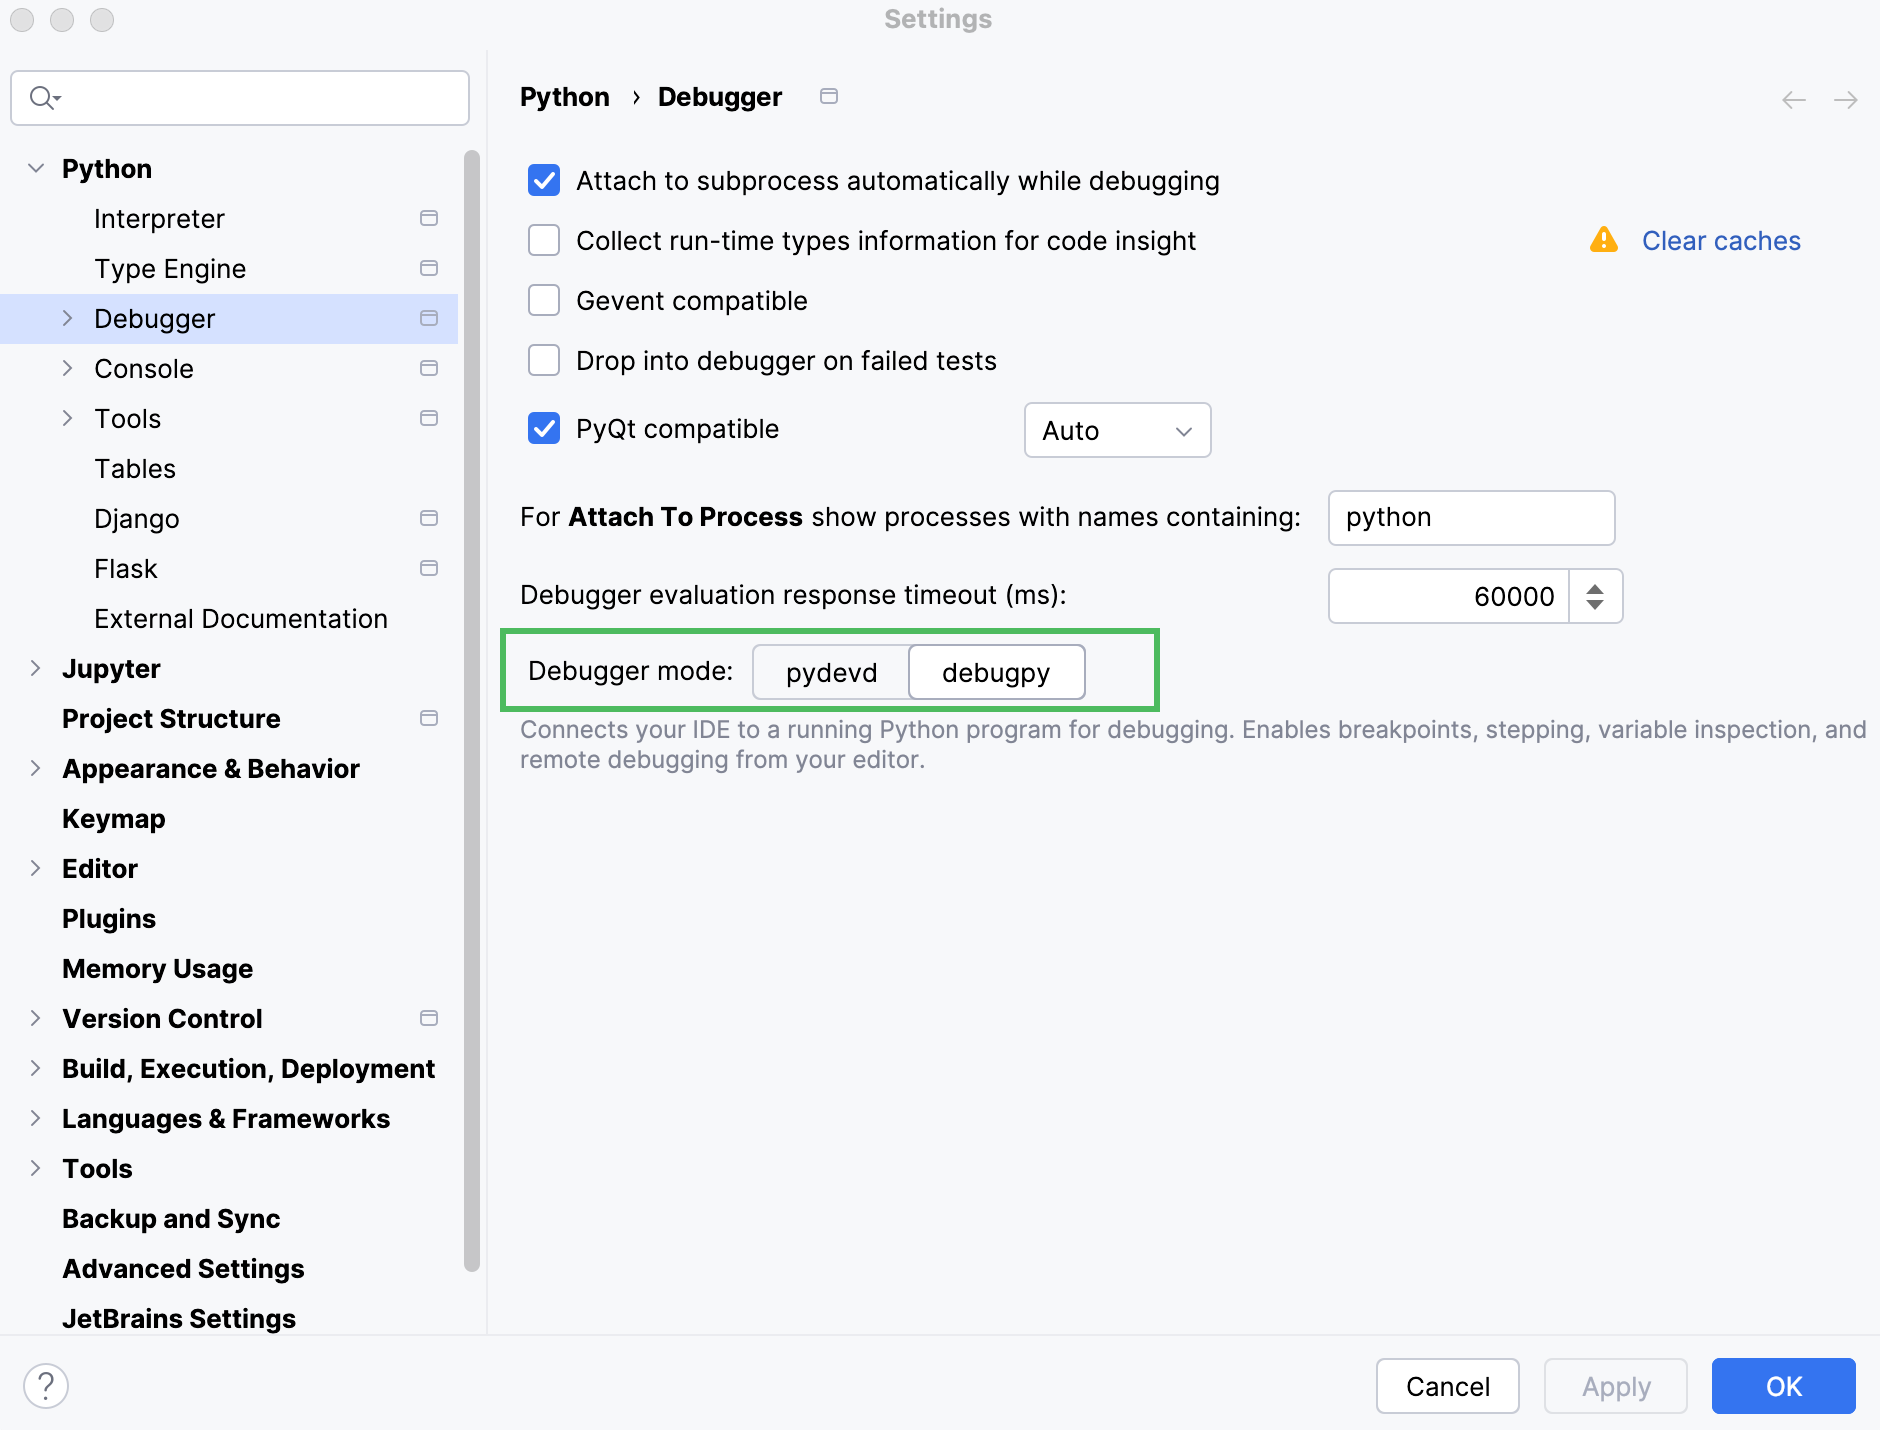
PyCharm supports multiple debugger implementations. In addition to the default PyCharm debugger, you can use debugpy, which is based on the Debug Adapter Protocol.
To enable debugpy, do one of the following:
Go to . Select the required option in the Debugger mode field.

Hover over the Debug tool window and use the selector in the upper-right corner.

Configure debugging options
Configure common debugging properties and behavior in .
If you are new to debugging, the out-of-the-box configuration will work for you. The topics about each debugger functionality provide references and explain the related settings where applicable. If you are an advanced user and looking for some particular property, see the Debugger reference section.
Under the Build, Execution, and Deployment section, select Debugger, and configure the Python debugger options.
Under the section, configure the Python packages that might be required for some debugging configurations.
Define a run/debug configuration if you are going to use a custom one. This is required if you need some arguments to be passed to the program or some special activity to be performed before launch. For more information about setting up run/debug configurations, refer to the Run/debug configurations section. Most of the time, you don't need this to debug a simple program that doesn't expect arguments or have any special requirements.
General debugging procedure
There is no one-size-fits-all procedure for debugging applications. Depending on actual requirements, you may have to use different actions in a different order. This topic provides general guidelines, which represent typical debugging steps. The details on how and when to use particular features are provided in the respective topics.
Define where the program needs to be stopped. This is done using breakpoints. Breakpoints are special markers, which represent places and conditions when the debugger needs to step in and freeze the program state. A program, which has been frozen by the debugger is referred to as suspended.
The alternative to using breakpoints is manually suspending the program at an arbitrary moment, however this method imposes some limitations on the debugger functionality and doesn't allow for much precision as to when to suspend the program.
Run your program in debug mode.
Just right-click any line in the editor and select the Debug <filename> command from the context menu.
After the program has been suspended, use the debugger to get the information about the state of the program and how it changes during running.
The debugger provides you with the information about variable values, the current state of the threads, breakdown of objects that are currently in the heap, and so on. It also allows you to test your program in various conditions by throwing exceptions (for example, to check how they are handled) or running arbitrary code right in the middle of the program execution.
While these tools let you examine the program state at a particular instant, the stepping feature gives you the control over step-by-step execution of the program. By combining the tools you can deduce where the bug is coming from and test your program for robustness.