Remote Debugging with PyCharm
With PyCharm you can debug your application using an interpreter that is located on the other computer, for example, on a web server or dedicated test machine.
PyCharm provides two ways to debug remotely:
Case: Use this approach to leverage extended debugging capabilities available on the remote machine.
Requirements: SSH access from the local machine to the remote server.
Using the Python remote debug server configuration.
Case: Use this approach to integrate the debugging process into the series of running processes on the remote server. This might be helpful when you cannot explicitly run your application for debugging, or when some preparations are required.
Requirements: SSH access from the local machine to the remote server, access from the remote server to the local machine using any predefined port.
Before you start
Complete the following preparation tasks:
On the local machine, create a pure Python project, as described in the section Create a Python project.
Add a Python file to this project (Alt+Insert - Python File).
Add the following code to the Python File:
import math class Solver: def demo(self, a, b, c): d = b ** 2 - 4 * a * c if d > 0: disc = math.sqrt(d) root1 = (-b + disc) / (2 * a) root2 = (-b - disc) / (2 * a) return root1, root2 elif d == 0: return -b / (2 * a) else: return "This equation has no roots" if __name__ == '__main__': solver = Solver() while True: a = int(input("a: ")) b = int(input("b: ")) c = int(input("c: ")) result = solver.demo(a, b, c) print(result)
Creating a deployment configuration for a remote interpreter
In this example, the machine where you run your application is referenced as local, and the machine with the remote interpreter is referenced as remote.
Configure a remote interpreter
Ensure that you have SSH access to the remote machine.
Add a new remote interpreter to the project as described in Configure an interpreter using SSH specifying the credentials to connect to the remote machine.
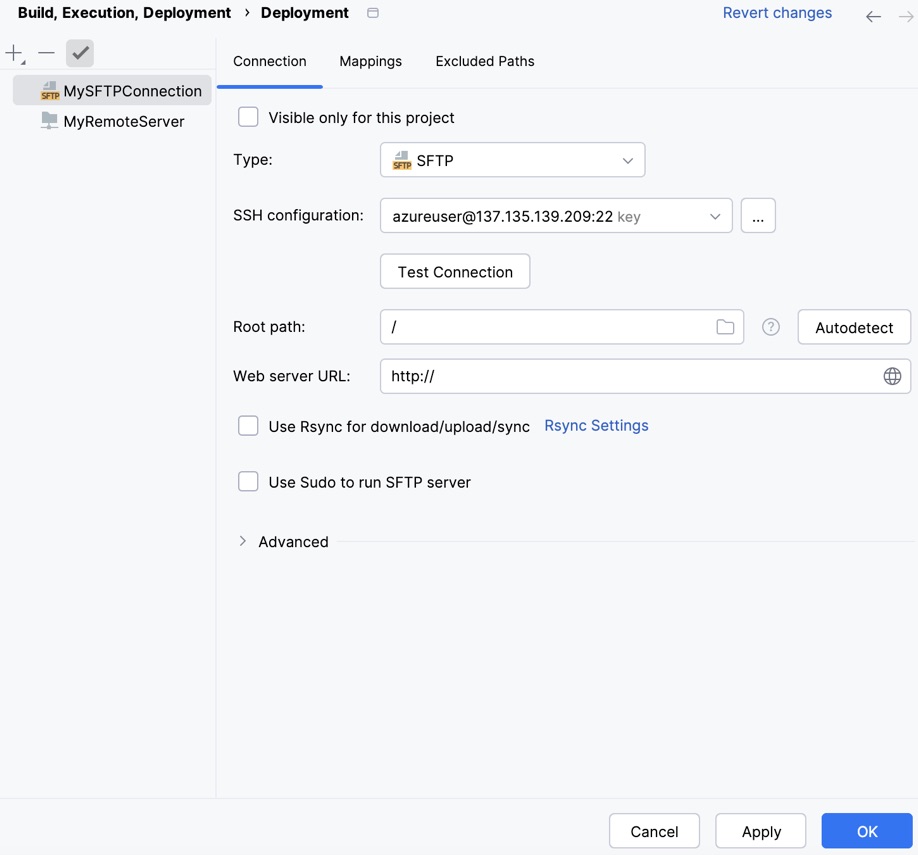
Once you create the remote interpreter for your project, the corresponding deployment configuration is created. To preview it, press Ctrl+Alt+S to open the Settings dialog window on the local machine and go to .

You can accept all default settings or alter them if needed. For this example we will use MySFTPConnection as a name of deployment configuration.
Ensure that the Root path value reflects the path specified in the corresponding settings of the created SSH interpreter.
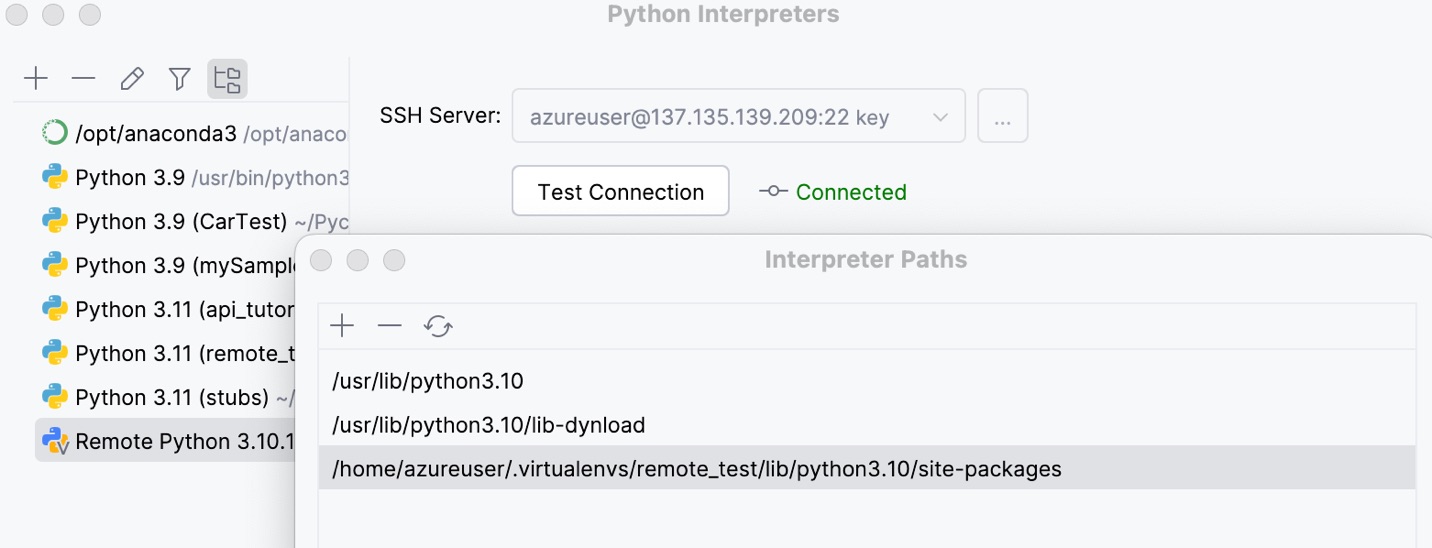
Press Ctrl+Alt+S to open settings and go to . Expand the list of the available interpreters, select Show All..., and click
. The existing paths of the selected interpreter show up in the Interpreter Paths dialog.

Now your deployment configuration is ready.
Deploy your application to a remote host
Next, your application should be deployed to the remote host.
In the menu, select .
File Transfer tool window appears. Verify the number of transferred files.

Debug your application
Right-click the editor background and choose the (here ) .
Review the debugging output.

Remote debugging with the Python remote debug server configuration
You can also enable remote debugging with the dedicated run/debug configuration, namely, Python Debug Server.
Create a run/debug configuration
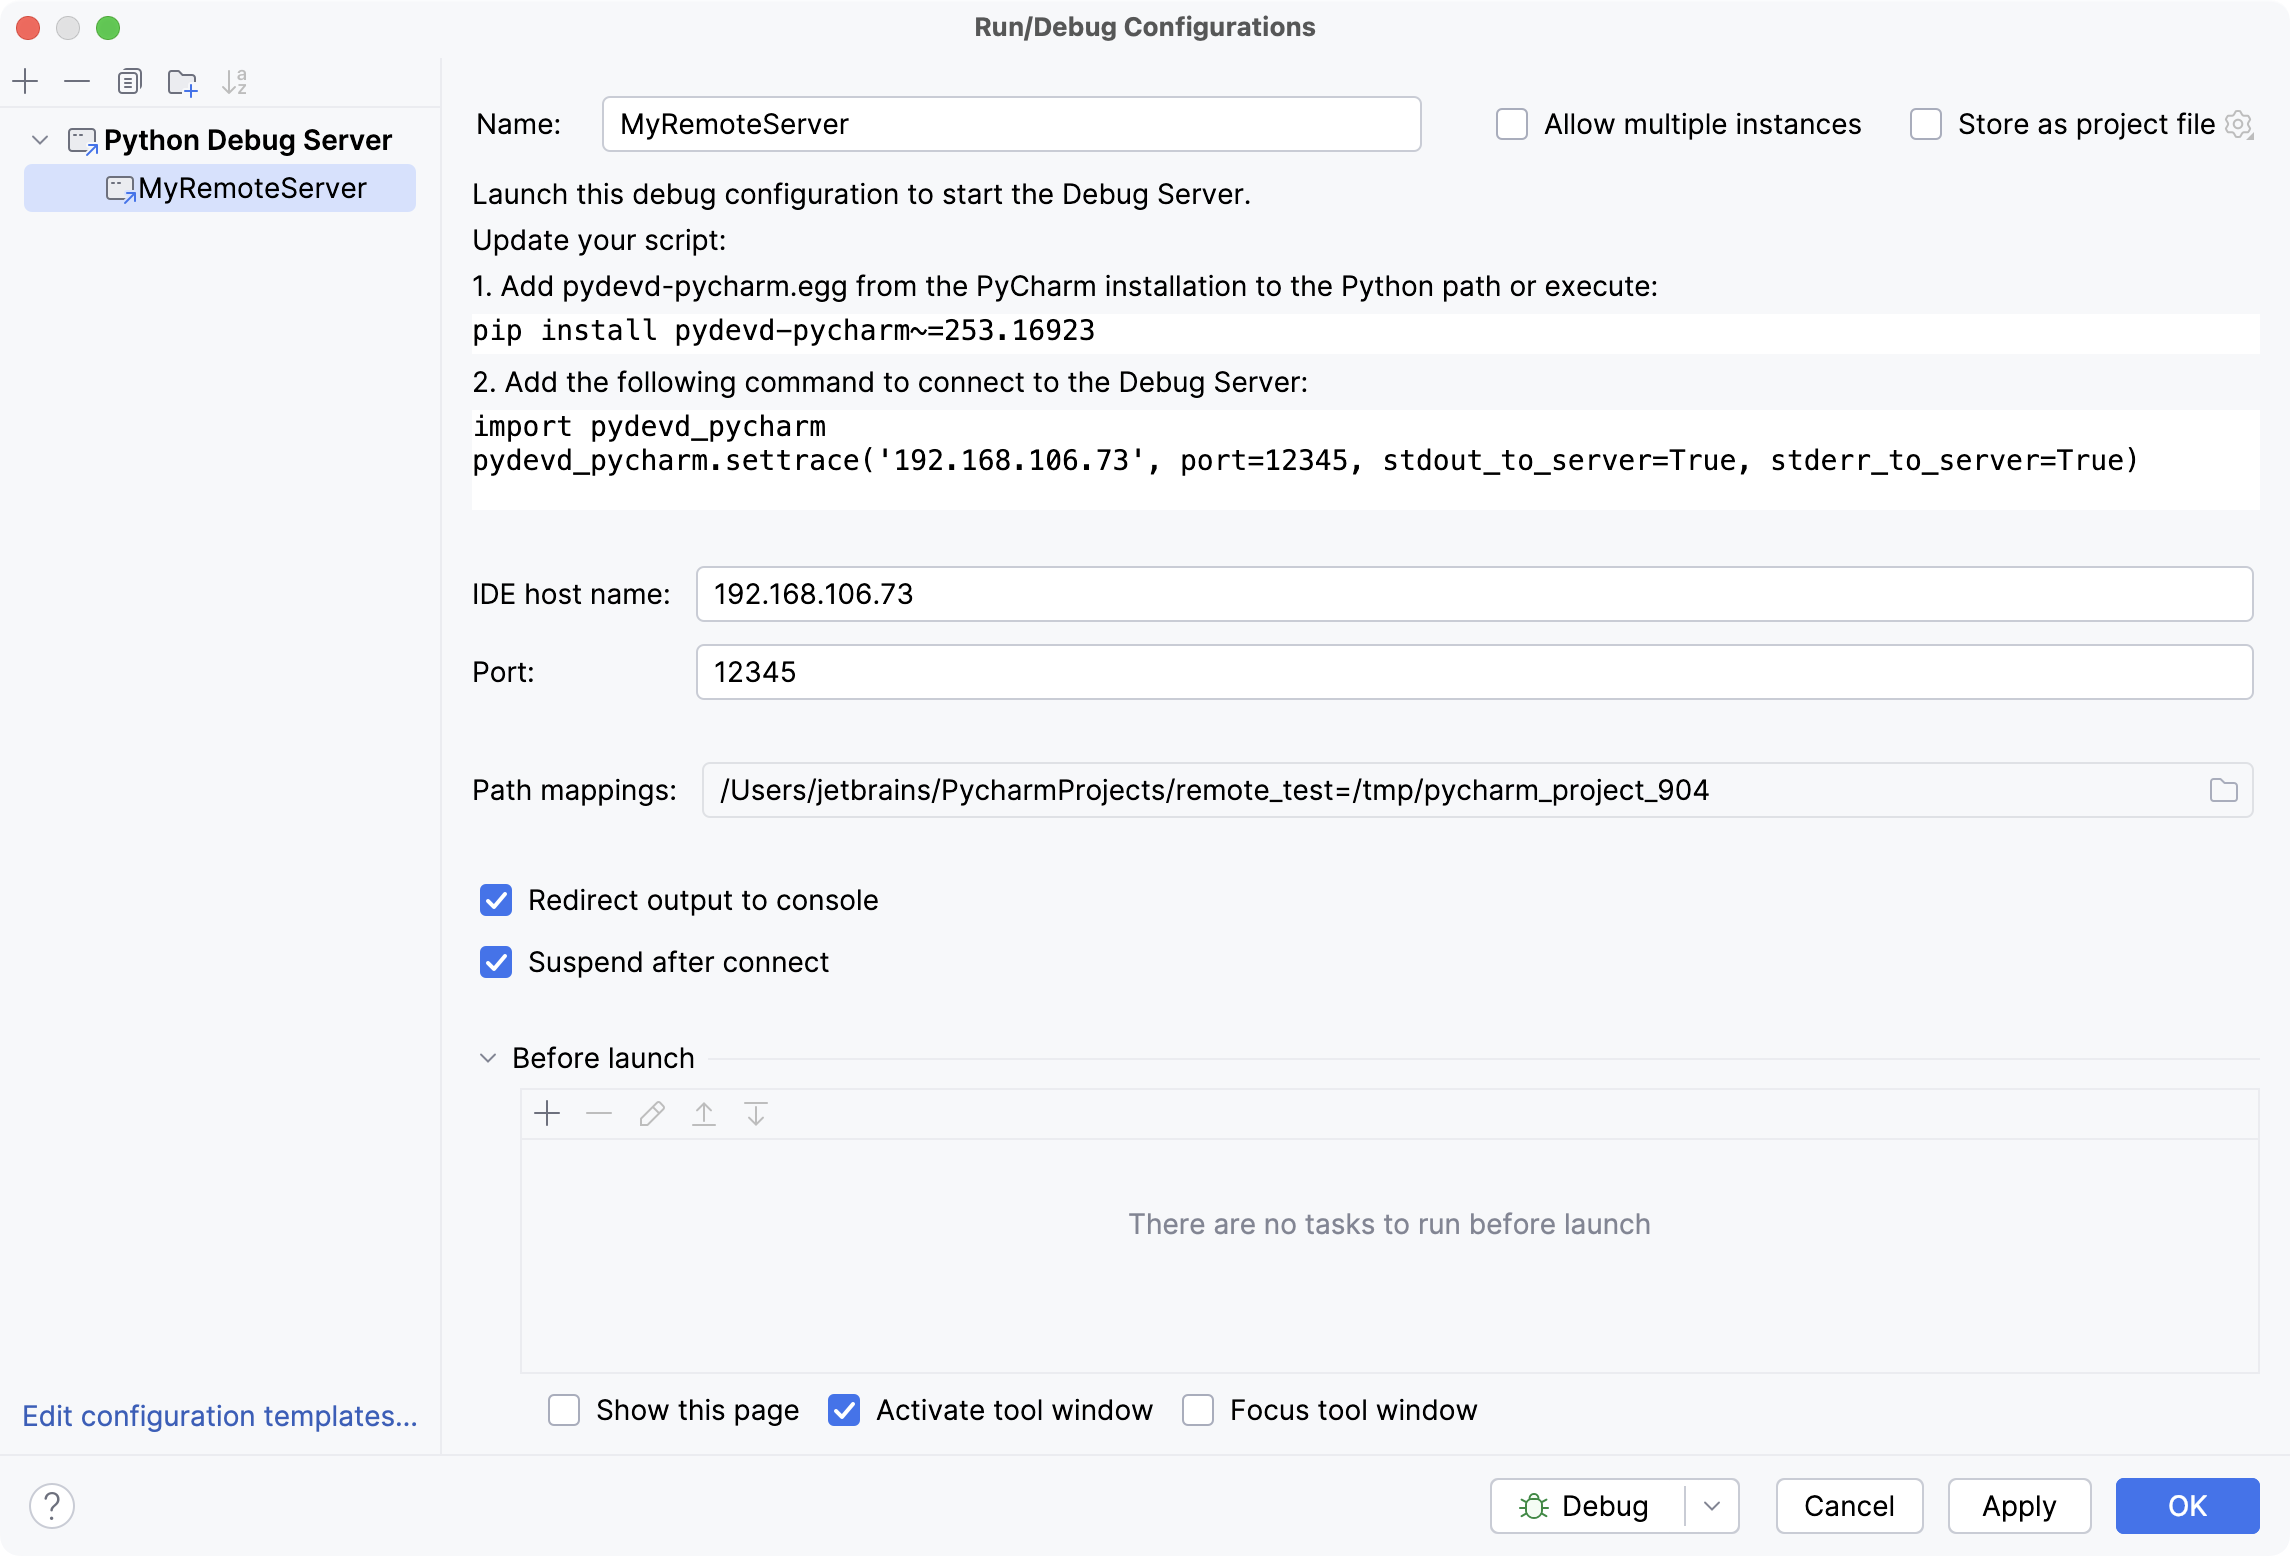
Go to The Run/debug configurations dialog opens. Click
on the toolbar, and from the list of available configurations, select Python Debug Server.

Enter the name of this run/debug configuration – let it be MyRemoteServer. Specify the Port number (here 12345) and the IDE host name (here 192.168.106.73) of the machine where the IDE is running. These parameters will be used by the remote debug server to access it.
Click
in the Path Mappings field. Map the path on the local machine to the path on the remote machine:

Inspect the Update your script instructions. You can use the pydevd-pycharm.egg from the PyCharm installation (<PyCharm directory>/debug-egg/pydevd-pycharm.egg) or install the
pydevd-pycharmpackage using pip.Depending on your choice, perform the following changes:
Install the
pydevd-pycharmpackage on the remote machine by running the following command:pip install pydevd-pycharm~=<version of PyCharm on the local machine>for example,
pip install pydevd-pycharm~=242.20224.428)Modify the source code file as follows:
import math #==============this code added==================================================================: import pydevd_pycharm pydevd_pycharm.settrace('192.168.106.73', port=12345, stdout_to_server=True, stderr_to_server=True) #================================================================================================ class Solver: def demo(self, a, b, c): d = b ** 2 - 4 * a * c if d > 0: disc = math.sqrt(d) root1 = (-b + disc) / (2 * a) root2 = (-b - disc) / (2 * a) return root1, root2 elif d == 0: return -b / (2 * a) else: return "This equation has no roots" if __name__ == '__main__': solver = Solver() while True: a = int(input("a: ")) b = int(input("b: ")) c = int(input("c: ")) result = solver.demo(a, b, c) print(result)Modify the code as follows:
import math #==============this code added==================================================================: import sys sys.path.append("<PyCharm directory>/debug-egg/pydevd-pycharm.egg") import pydevd_pycharm pydevd_pycharm.settrace('172.20.208.95', port=12345, stdout_to_server=True, stderr_to_server=True) #================================================================================================ class Solver: def demo(self, a, b, c): d = b ** 2 - 4 * a * c if d > 0: disc = math.sqrt(d) root1 = (-b + disc) / (2 * a) root2 = (-b - disc) / (2 * a) return root1, root2 elif d == 0: return -b / (2 * a) else: return "This equation has no roots" if __name__ == '__main__': solver = Solver() while True: a = int(input("a: ")) b = int(input("b: ")) c = int(input("c: ")) result = solver.demo(a, b, c) print(result)
Create a SFTP connection
On the remote machine, create a directory where the file quadratic_equation.py should be uploaded. You can do it in the Terminal window:
$cd /tmp $mkdir pycharm_project_986On the local machine, create a connection profile. Go to In the dialog that opens, click
, and in the Add Server dialog select the connection type (here SFTP) and enter its name (here MySFTPConnection).
In the Connection tab, specify the SFTP host (address of the remote machine), username and password for that machine.
Note that the specified user should have SSH access to the remote host.
Click Mappings tab, and enter the deployment path in the server. Click the browse button and select the required folder /tmp/pycharm_project_986. Note that the browse button shows the contents of the remote host. Apply the changes and close the dialog.
Deploy files to the remote machine
Deploy the following files to the remote machine: pydevd-pycharm.egg and quadratic_equation.py.
On the local machine, in the Project tool window, select the files, right-click the selection and choose Deployment | Upload to MySFTPConnection.
Inspect the File Transfer dialog window to ensure that the files from the local machine are uploaded to the remote server.

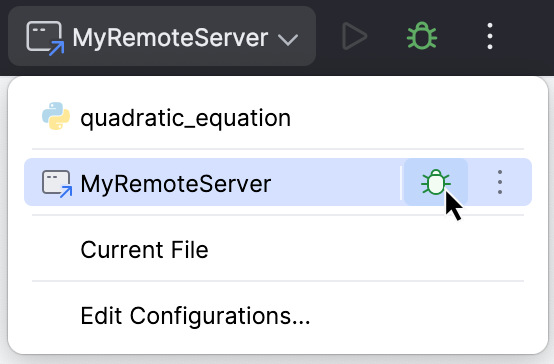
Launch the Debug Server
Choose the created run/debug configuration, and click
:

Ensure that the Debug window shows the Waiting for process connection... message. This message will be shown until you launch your script on the remote machine, and this script will connect to the Debug Server.
Execute the Python file on the remote machine
On the remote machine, navigate to the tmp/pycharm_project_986 directory.
Launch the quadratic_equation.py file on the remote host. To do that, in the Terminal window, enter the following command:
$python3 quadratic_equation.py$python quadratic_equation.pyThe most helpful aspect of this debugging method is that you can run execution the Python file using any of your bash scripts when remote debugging is part of a scheduled task or when you need to execute some preparation steps before running the Python script. If that's the case, add the following lines to the appropriate place of your bash script:
cd /tmp/pycharm_project_986 python3 quadratic_equation.pycd /tmp/pycharm_project_986 python quadratic_equation.py
Debug your application
On your local machine, switch to the Debug window. It will show the connection to the pydev debugger.
Your code is actually executed on the remote host but debugged on the local machine.
Summary
In order to debug with a remote interpreter, you have to start your program through PyCharm, which is not always possible. On the other hand, when using the Debug Server, you can connect to a running process.
Compare the two approaches.
In the first case, we
In the second case, we
created a debug configuration (Debug Server).
executed the Python script on the remote machine. The script connects to the Debug Server.
debugged the script on your local machine.