Debugging in Console
In you have once started IRB or Rails console, you've noticed that a temporary run/debug configuration for consoles has been created, and has appeared in the list of available run/debug configurations.
If necessary, you can save this run/debug configuration as a permanent one.

This run/debug configuration makes it possible to rerun a console, or launch it in debug mode. Moreover, you can also debug source code from the editor immediately in the console.
To debug source code in a console, follow these general steps
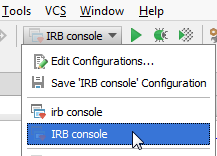
- On the main toolbar, click the run/debug configuration selector, and choose a temporary or permanent run/debug configuration for console. Refer to the section Running and Rerunning Applications.
- With the desired console run/debug configuration selected, click
 .
. 
The console starts in debug mode.
- Make sure that the class you want to debug is opened in the active editor, and breakpoints are set:

- Do one of the following: The whole file from the active editor is loaded into the console.
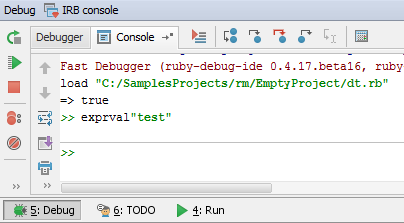
- In the Console tab of the debugger, type the name of the method you want to debug:

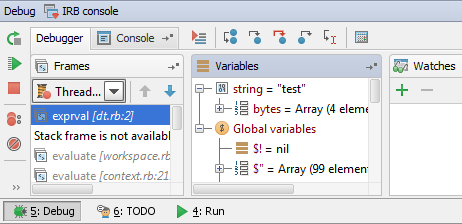
Breakpoint is hit:

Debug tool window shows the Debugger tab:

- Proceed through the code, using the stepping toolbar buttons. Explore threads, variables, and watches.
Last modified: 26 October 2017