Starting the Debugger Session
Before debugging
- Set breakpoints in the source code.
- If necessary, create or modify the corresponding Run/Debug configuration.
The debug session starts with the selected run/debug configuration. Note that several debug processes can be launched simultaneously.
For example, debugging session for a Python script will start with the default temporary run/debug configuration, unless you select a permanent one.
Debugging an application
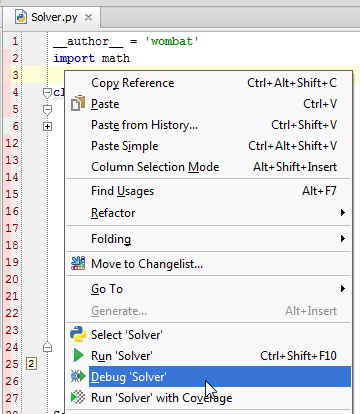
To start debugging a Python script
- Open the desired Python script in the editor, or select it in the Project tool window.
- On the context menu, choose :

Note that after you've launched a debug session, the ![]() icon that marks the Debug Tool Window toggles to
icon that marks the Debug Tool Window toggles to ![]() to indicate that the debugging process is active.
to indicate that the debugging process is active.
Last modified: 26 October 2017