Step 2. Debugging Your First Python Application
Finding out the origin of the problem
Remember, in the previous tutorial you've created and run the Car script? Let’s play a little more with it.
Let's see what happens when we start our script up, and try to find out our average speed:

Oops... PyCharm reports a run-time error: a ZeroDivisionError.
Let’s dig a little deeper into our code to find out what’s going wrong. We can use the PyCharm debugger to see exactly what’s happening in our code. To start debugging, you have to set some breakpoints first. To create breakpoints, just click in the left gutter:
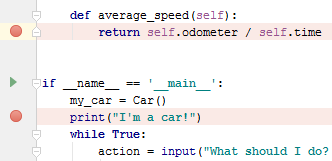
Next, click the ![]() icon in the left gutter, next to the
icon in the left gutter, next to the main clause, and choose Debug 'Car'. PyCharm starts a debugging session and shows the Debug tool window.

In the Console tab, enter S:

As you see, the breakpoint marker became blue. It means that we've reached the breakpoint; note that the highlighted line of code hasn't yet been executed at this point.
Click the ![]() button to resume the script execution. Now lo and behold! The exception is here. Another breakpoint appeared as well: by default PyCharm will halt for any exception that wasn't caught in your code, and it'll show an icon of a breakpoint with a lightning bolt. If you're interested in all types of breakpoints supported by PyCharm, see the table of breakpoint signs.
button to resume the script execution. Now lo and behold! The exception is here. Another breakpoint appeared as well: by default PyCharm will halt for any exception that wasn't caught in your code, and it'll show an icon of a breakpoint with a lightning bolt. If you're interested in all types of breakpoints supported by PyCharm, see the table of breakpoint signs.

The Console also shows the error message. So we’ve found our problem. You can also see in the debugger, that the value self.time is equal to zero:

Surrounding code
To avoid running into the same problem again, let's add an if statement to check whether the time equals zero. To do that, select the statement return self.odometer / self.time in the method average_speed and then press Ctrl+Alt+T ():

PyCharm creates a stub if construct, leaving you with the task of filling it with the proper contents.
After editing, we get the following:

Let's take a closer look to see how the debugger can show your what your code is doing.
Debugging in detail
The Debug tool window shows dedicated panes for frames, variables, and watches, and the console, where all the input and output information is displayed. If you want the console to be always visible, you can drag it to one of the PyCharm window's edges.
Stepping
If you want to see what your code does line by line, there's no need to put a breakpoint on every line, you can step through your code.
Let's see what it looks like to step through our example program: click the ![]() button, go to the Console to ask for the car's average speed (type 'S'), and we can see that we hit our breakpoint.
button, go to the Console to ask for the car's average speed (type 'S'), and we can see that we hit our breakpoint.
We can use the stepping toolbar buttons to choose on which line we'd like to stop next.

For example, click the Step Over button (![]() ) and see the blue marker moving to the next line of code:
) and see the blue marker moving to the next line of code:

If you click the Step Into button (![]() ), you will see that after the line
), you will see that after the line action = input("What should I do? [A]ccelerate, [B]rake, " "show [O]dometer, or show average [S]peed?").upper() the debugger goes into the file parse.py:

However, if you continue using ![]() , you'll see that your application just passes to the next loop:
, you'll see that your application just passes to the next loop:

If you want to concentrate on your own code, use the Step Into My Code button (![]() ) - thus you'll avoid stepping into library classes.
) - thus you'll avoid stepping into library classes.
See the Stepping toolbar and Stepping Through the Program sections for details.
Watching
PyCharm allows you to watch any variable. Just click ![]() on the toolbar of the Variables tab, and type the name of the variable you want to watch - let it be
on the toolbar of the Variables tab, and type the name of the variable you want to watch - let it be self.time. Note that code completion is available here:

At first, you see an error - it means that the variable is not yet defined:

However, when the program execution continues to the scope that defines the variable, the watch gets the following view:

See Adding, Editing and Removing Watches section for details.
Inline debugging
You may have noticed another PyCharm feature that makes it easy to see what your code is doing: the inline debugger. As soon as you hit any breakpoint, PyCharm shows you the value of many of your variables right in the editor:

This inline debugging feature is enabled by default. If you don't see the inline debugging values, please check that it's enabled using the settings icon ![]() on the Debug Tool Window:
on the Debug Tool Window:

Evaluating expressions
Finally, you can evaluate any expression at any time. For example, if you want to see the value of a variable, click the ![]() button:
button:

Then in the dialog box that opens, click Evaluate:

Actually, you could see the same thing with a watch. With evaluate expression you can do things that you can't do with a watch: you can change things.
For example, if you enter the desired value of the odometer, say, 50, and then continue stepping through your script, you will get the following:

See the Evaluating Expressions section for details.
Summary
So, you've done it! Congrats! Let's repeat what you've done with the help of PyCharm:
- Found out the origin of the problem
- Set breakpoints
- Stepped through your program
- Created a watch
- Evaluated an expression