Debugging Django Template Tutorial
This feature is only supported in the Professional edition.
Before you start
Make sure that:
- You are working with PyCharm Professional Edition. This tutorial has been prepared with PyCharm version 2017.2.
- Django is specified as the project template language. See section Configuring Template Languages for details.
Preparing an example
First, let's create a Django project MyDjangoProject1, with the application poll.
Next, open the file views.py for editing(F4) and see that the import statement is already there. In the second line you see the invitation to do something manually:
from django.shortcuts import render

# Create your views here.
Type the following code:
from django.shortcuts import render


def index(request):
    return render(request, 'index.html', context={'hello': 'world'})
You see that index.html is marked as unresolved reference:

Press Alt+Enter or click ![]() and choose to create the missing template:
and choose to create the missing template:

In the file index.html type the following code:
{% for char in hello %}
    {{ char }}
{% endfor %}
It means that the value world of the variable hello will be printed one character after another.
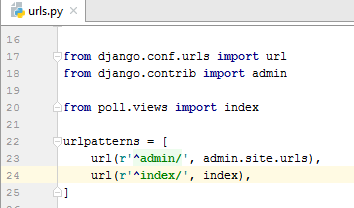
Next, open for editing the urls.py file (F4), in this file find (Ctrl+F) the string url and after the url of the admin site, type the following code:
url(r'^index/', index),Do not forget about the import statement!
from polls.views import indexYou should end up with the following:

So the example code is ready.
Adding breakpoint to a template
Let's add a breakpoint to the template index.html. To do that, open for editing the file index.html (F4) and click the left gutter:

Editing and launching a run/debug configuration
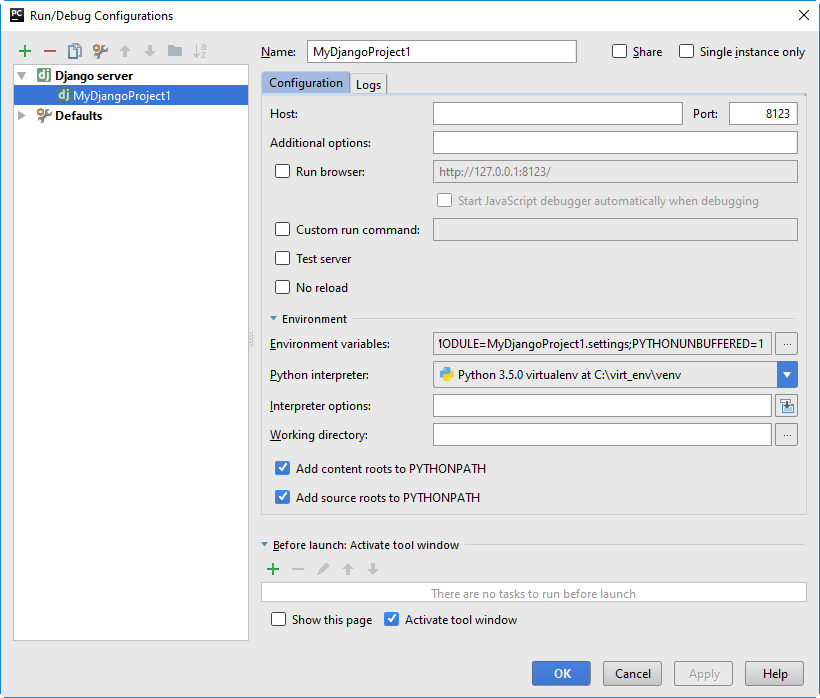
Note that Django server run/debug configuration is created automatically, and the only thing required is editing it. To change this run/debug configuration, in the drop-down choose the Edit Configurations... command:

For example, change the port number. Here it will be 8123.

Next, let's launch this run/debug configuration in the debug mode: choose this configuration from the drop-down and click ![]() :
:

You see that the name of the run/debug configuration in the drop-down, the ![]() button and the Debug tool window are marked with a dot, which means that the run/debug configuration becomes active.
button and the Debug tool window are marked with a dot, which means that the run/debug configuration becomes active.
The run/debug configuration shows the error message (404), because neither admin site, nor index page are present. However, we need to suspend our application at the breakpoint. To do so, we need to add the name index to the contents of the address bar. The page is still not found, but in PyCharm you see the template with the hit breakpoint:

and the Debug tool window.
Working with the Debug tool window
In the Django applications, all the functions of the Debug Tool Window are available, same as for the pure Python scripts. For example, you can step through your application, evaluate expressions, watch variables and more.
Stepping through the template
The stepping toolbar becomes active, and the stepping buttons are available. For example, click ![]() and see that the value of the
and see that the value of the char variable changes to the next letter of the word world.
See the Stepping Through the Program section for details.
Evaluating an expression
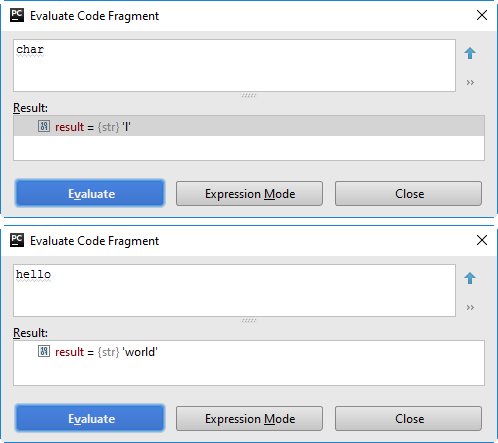
Press Alt+F8, or, on the Stepping toolbar, click ![]() . In the dialog box that opens, type the expression you wish to evaluate, and click Evaluate:
. In the dialog box that opens, type the expression you wish to evaluate, and click Evaluate:

See the Evaluating Expressions section for details.
Watching variables
Suppose, you'd like to always keep an eye on a certain variable of a template, say, char. How to do that?
In the Variable tab, make sure that the ![]() button is pressed (if this button is pressed, then the watches are visible in the Variables tab), and then click the
button is pressed (if this button is pressed, then the watches are visible in the Variables tab), and then click the ![]() button. Type the name of the variable of interest, and now your watch is always on top of the Variables tab:
button. Type the name of the variable of interest, and now your watch is always on top of the Variables tab:

See the Adding, Editing and Removing Watches for details.
Summary
That's it... What has been done here? Let's repeat:
- You've created a Django project, with a template in it.
- You've added a breakpoint to this template.
- You've created the Django server run/debug configuration, and launched it in the debug mode.
- Having hit the breakpoint, you've stepped through your template, evaluated expressions and added watches.
The next step is also intended for the Professional edition users - this is Debugging JavaScript.