Debugging Django Templates
This feature is only supported in the Professional edition.
Introduction
PyCharm allows placing breakpoints to the lines of Django template files, at the lines with Django tags or expressions.
Prerequisite
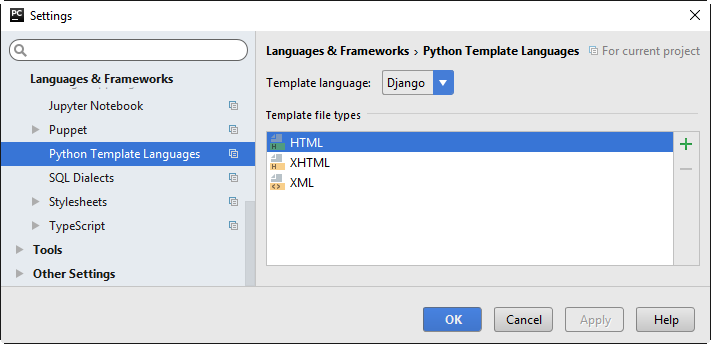
Django is specified as the project template language.
To do that, open the Project Settings dialog, under the Project Settings select page Python Template Languages, select project where the templates reside, and then choose Django from the Template Language drop-down list.

Debugging a Django template
- If you want to trace back exceptions that are raised in course of template debugging, open Breakpoints dialog, and in the Django Exception Breakpoints tab, select the checkbox Suspend.
- Debugging Jinja and Mako templates is not supported.
To debug a Django template, follow these general steps
- Place breakpoints in the desired lines of the Django templates:

- Launch Django server in the Debug mode.
This is how it's done:
- On the main menu, choose .
- If the desired Django Server run/debug configuration exists, select it, otherwise create a new one, as described in the section Creating and Editing Run/Debug Configuration.
- Then click the button
 on the main toolbar, or press Shift+F9.
PyCharm will open the template in your browser, and suspend at the breakpoints you've set.
The Debugger session starts, and Debug tool window appears.
- In the Debug tool window, you can:
- Examine the rendering contexts in the Variables pane.
- Step through the breakpoints defined within the Django template.
- Use the debugging console.
Last modified: 28 March 2018