Scientific Mode Tutorial
Introduction
In this tutorial, we'll try to run and debug a Python code with graphs using PyCharm.
Prerequisite
Make sure that the Matplotlib and numpy packages are added to your interpreter. Read the Installing, Uninstalling and Upgrading Packages section for details.
Example
Add the Python file sample.py to the root of your project and enter the following code:
import numpy as np
import matplotlib.pyplot as plt


N = 50
x = np.random.rand(N)
y = np.random.rand(N)
colors = np.random.rand(N)
area = np.pi * (15 * np.random.rand(N))**2  # 0 to 15 point radii

plt.scatter(x, y, s=area, c=colors, alpha=0.5)
plt.show()

X = np.linspace(-np.pi, np.pi, 256,endpoint=True)
C,S = np.cos(X), np.sin(X)


plt.plot(X, C, color="blue", linewidth=2.5, linestyle="-")
plt.plot(X, S, color="red", linewidth=2.5, linestyle="-")


plt.xlim(X.min()*1.1, X.max()*1.1)
plt.xticks([-np.pi, -np.pi/2, 0, np.pi/2, np.pi],
[r'$-\pi$', r'$-\pi/2$', r'$0$', r'$+\pi/2$', r'$+\pi$'])

plt.ylim(C.min()*1.1,C.max()*1.1)
plt.yticks([-1, 0, +1],
[r'$-1$', r'$0$', r'$+1$'])

plt.show()

pass
Running
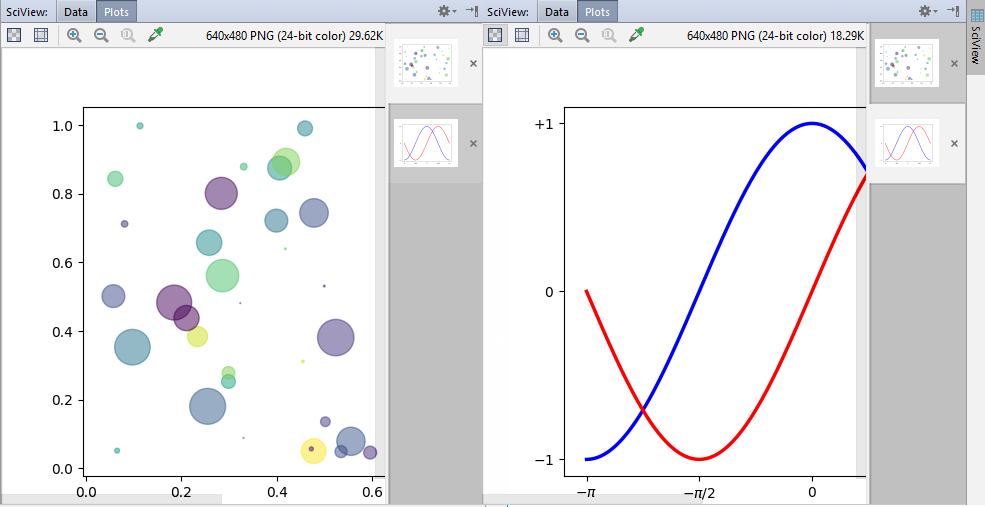
Open the sample.py file for editing (F4) and right-click the editor background. On the context menu, choose Run 'sample'. The code is executed and shows two graphs in the SciView. Clicking the preview thumbnail displays the respective graph:
Debugging
Let's put a breakpoint at the line:
plt.show()This line appears twice in our example code, and so there will be two breakpoints.
Right-click the editor background and on the context menu choose Debug 'sample'.
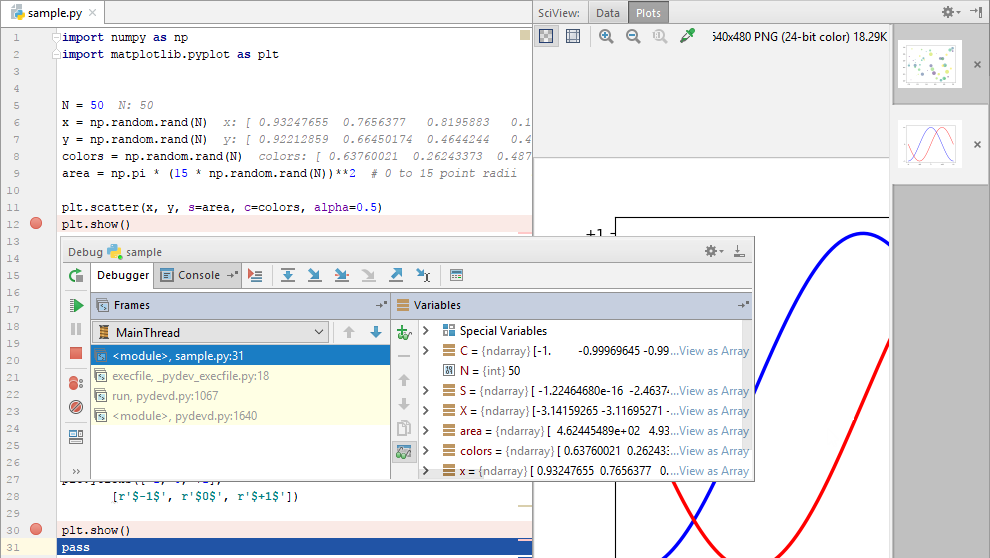
You see the Debug tool window and the grey characters in the editor. This is the result of the inline debugging, which is enabled.
The line with the first breakpoint is blue highlighted. It means that the debugger has stopped at the line with the breakpoint, but has not yet executed it. If we execute this line (for example, by clicking the ![]() button on the stepping toolbar of the Debug tool window), we'll see the graph:
button on the stepping toolbar of the Debug tool window), we'll see the graph:
Next, look at the Variables tab of the Debug tool window. If you right-click the area array, you'll see the View as Array command on the context menu.
Choosing this command results in opening the Data tab in the SciView:
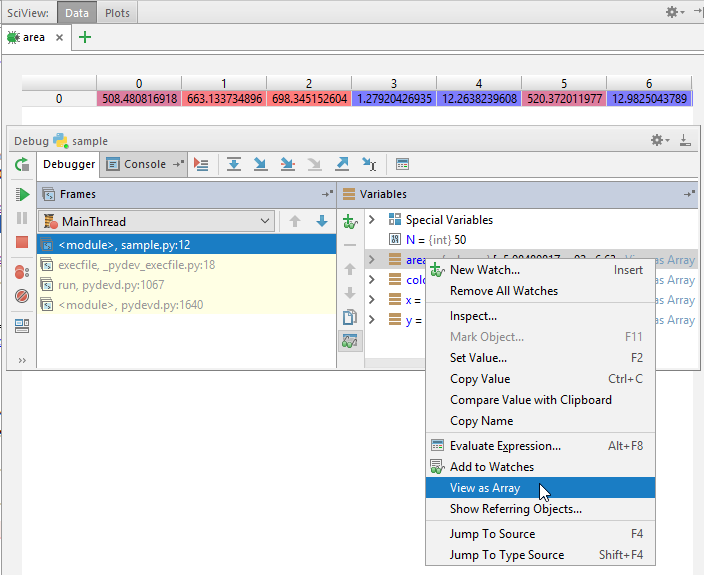
Mind the only row of figures in the Data tab in the SciView - it's explained by the fact that the area array is one-dimensional.
Running in console
Right-click the editor background and choose the Run File in Console command:
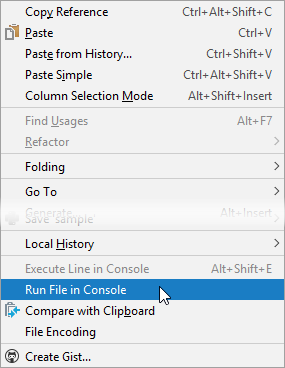
This command corresponds to running a run/debug configuration for the sample.py file with the Show command line afterwards checkbox selected:
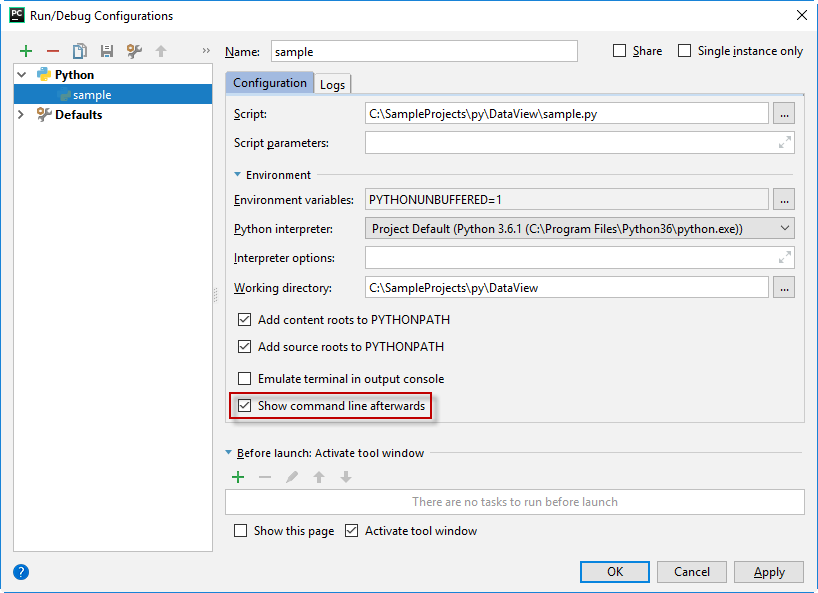
When this command is run, the >>> prompt appears after the output in the Run tool window, and you can execute your own commands.
Summary
So, what has been done with the help of PyCharm?
- The file
sample.pywas created and opened for editing. - The source code has been entered (note the powerful PyCharm's code completion!)
- The source code has been run and debugged.
- Finally, we ran the file in console.