Stepping Through the Program
Introduction
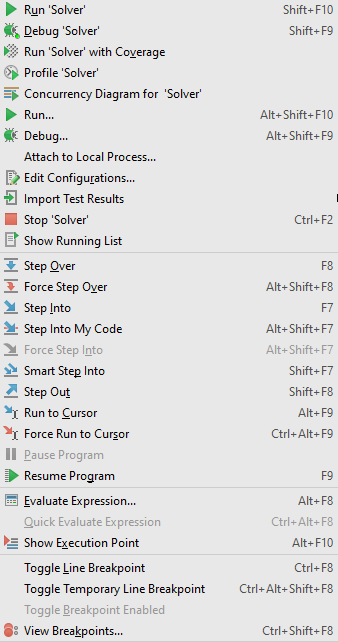
When a breakpoint is reached or your program is suspended, the Debug tool window becomes active and enables you to get control over the program's execution. For this purpose, you can use the menu commands, or the icons on the stepping toolbar of in the Debug tool window.
Each stepping action advances the execution point to the next execution location, depending on the action you choose.
Stepping through the program
Do one of the following:
- On the main menu, or on the editor's context menu, choose one of the <stepping command>

- Use the keyboard shortcuts.
- Use the buttons in the stepping toolbar of the Debug tool window.

Tips and tricks
- The Force Step Into command
 enables you to step into a method of a class not to be stepped into.
The classes, stepping into which is suppressed, are specified on the Stepping page of the Settings/Preferences dialog box. - The Force Step Over command
 enables you to jump over the method call ignoring the breakpoints on the way.
 - The Force Run to Cursor command
 enables you to jump to the cursor position ignoring existing breakpoints on the way.
 - Step Into My Code command
 helps skip stepping into library sources and keep focused on your own code.
Last modified: 28 March 2018