Watches
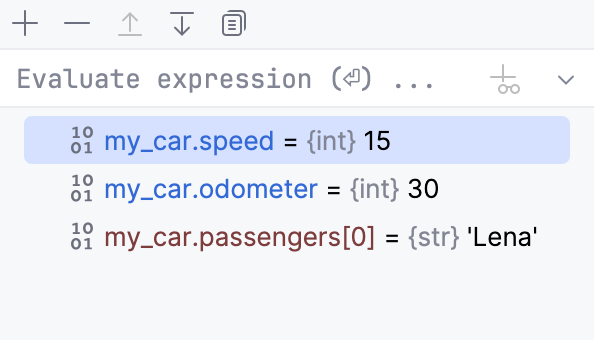
In the Watches pane you can evaluate any number of variables or expressions in the context of the current stack frame. The values are updated with each step through the application, and become visible every time the application is suspended.

While the command from the context menu of the Variables pane enables you to see one expression at a time, the Watches pane shows multiple expressions that persist from one debug session to another, until you remove them.
You can create watches in this pane, in the Variables pane, and also in the editor.
Watch expressions are always evaluated in the context of a stack frame that is currently inspected in the Frames pane. If an expression cannot be evaluated, it is displayed with a question mark.
Open the Watches pane
By default, the Watches pane is hidden and the watches are shown in the Variables pane.
To have the Watches pane displayed separately and view the configured watches in it, click
Layout Settings on the debugger toolbar and select Separate Watches.
Evaluate expression field
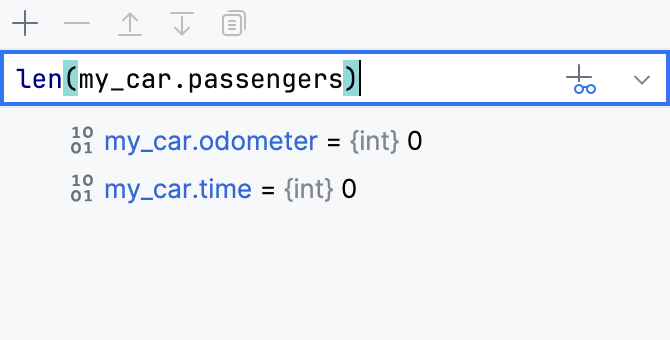
To evaluate an arbitrary expression, enter it in the Evaluate expression field in the Watches pane and press Enter
The result is displayed right below. You can also add the expression to watches by clicking
in the right-hand part of the expression field.

Toolbar
Item | Shortcut | Description |
|---|---|---|
Insert | Click this button to create a new watch. | |
Delete | Click this button to remove the selected watch from the list. | |
| Alt+UpAlt+Down | Use these buttons to change the order of watches. |
Ctrl+D | Use this button to create a copy of the selected watch. |
Context menu
Item | Shortcut | Description |
|---|---|---|
New Watch | Choose this command to create a new watch. A text field opens, where you can enter new watch expression. | |
Remove Watch | Delete | Choose this command to delete the currently selected watch expression from the list. |
Remove All Watches | Choose this command to delete all watch expressions from the list. | |
Edit | F2 | Choose this command to change the selected watch expression. |
Pause/Resume Watch | Choose this command to pause or resume a watch. | |
Customize Data View | Add a custom type renderer. | |
Inspect | This command is available for fields, local variables and reference expressions, and opens a non-modal Inspection window, where you can concentrate on a particular reference. You can open as many Inspection windows as required. The view in the Inspection window is the same as in the Watches pane, but requires less screen space. | |
Copy Value | Ctrl+C | Use this command to copy the value of the selected variable to the Clipboard. If multiple items are selected, not only variables' values, but also their structure is copied, so that when you copy-paste the selection to a text file, the indentation mimics the tree output of the debugger to produce an easy-to-read output. Alternatively, hover over a value and view its contents in the tooltip. |
Copy JSON | This menu item is available only in the JavaScript context. Choose this command to copy the selected value in the JSON format. | |
Compare Value with Clipboard | Use this command to compare the selected value with the value currently in the Clipboard. | |
Copy Name | Use this command to copy the name of the selected variable to the Clipboard. | |
Evaluate Expression | Alt+F8 | Use this command to evaluate the selected variable in the dialog that opens. |
Add to Watches | This command is available for all nodes except static ones. Use this command to create an expression that references the node and add this expression to the Watches pane. | |
Show Referring Objects | Use this command to display a list of objects referring to the currently selected variable. | |
Jump to Source | F4 | This command opens the source code of the selected variable or field in the editor and places the caret at the corresponding line. |
Jump to Type Source | F4 | Use this command to navigate to the definition of the class of the selected variable or field. |
View as Array | View as Array is available for variables that represent NumPy arrays. Choose this command to display the data in the Data View tool window. You can also click the View as Array link next to the variable. | |
View as Image | View as Image is available for variables that represent NumPy 1D, 2D or 3D arrays. Choose this command to display the data as an image in the Plots tool window. You can also click the View as Image link next to the variable. For more information, refer to Plots tool window. | |
View as DataFrame | View as DataFrame is available for variables that represent pandas data frames. Choose this command to display the data in the Data View tool window. You can also click the View as DataFrame link next to the variable. |