Part 3. Debugging JavaScript
The possibility to debug JavaScript is vital for web developers. With IntelliJ IDEA-based products, such debugging becomes quite easy. To illustrate the JavaScript debugging capabilities with PyCharm, we’ll create a very basic script that just shows some numbers in a browser page, and then debug it on a server.
In case of debugging on an external web server, the application files are deployed on it, and you have their copies on your computer. No matter, whether the web server itself is running on a physically remote host or on your machine, application files deployed on it are treated as remote.
When a remote HTML file that loads some JavaScript is opened, the debugger tells PyCharm the name of the currently processed file and the number of the line to be processed. PyCharm opens the local copy of this file and indicates the line with the provided number. This behaviour is enabled by specifying correspondence between files and folders on the server and their local copies. This correspondence is called mapping, it is set in the debug configuration.
Prerequisites
Make sure that:
You are working with PyCharm Professional Edition version 3.0 or higher.
You are working with Google Chrome.
You are using XAMPP as an application server.
This tutorial is created with the following tools:
PyCharm Professional 2017.1.
Google Chrome.
Creating a project
On the main menu, choose , and do the following:
choose the Pure Python project type
specify the project location
C:\SampleProjects\py\MyJSProjectchoose the project interpreter
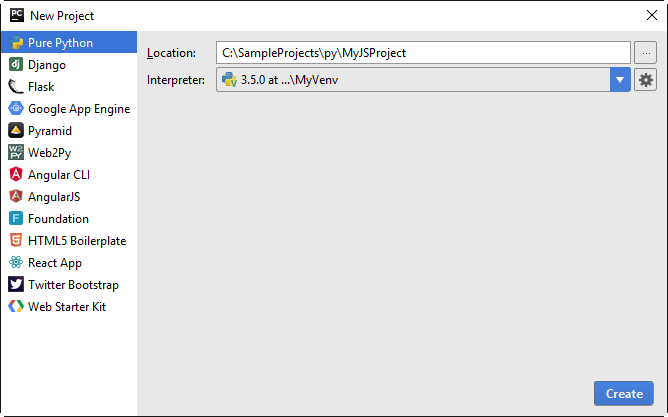
When ready, click Create.
Choose to open this new project in a separate window, not adding it to any of the currently open projects:

Preparing a sample code
First, let’s create a HTML page. To do that, with the Project Tool Window having the focus, press Alt+Insert, choose HTML file on the pop-up menu, and enter the file name numbers.
PyCharm stubs out an HTML file with some initial contents. Next, embed a reference to a JavaScript file into this HTML file. To do that, type the following code inside the <body> tags:
<script type="text/javascript" src="numbers.js" language="JavaScript"></script>Mind the code completion, which is available while you type:
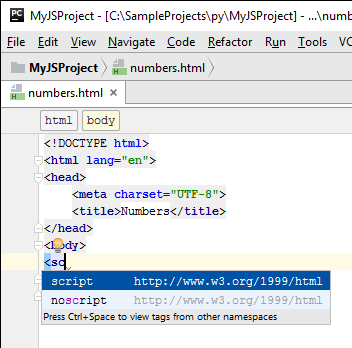
When ready, pay attention to the highlighted file name numbers.js. This is a reference to a non-existent JavaScript file. Place the caret at this name and press Alt+Enter (or click the yellow light bulb ![]() ); a quick fix is suggested – create the missing file:
); a quick fix is suggested – create the missing file:
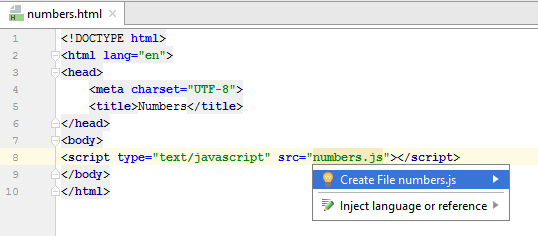
Choose this quick fix, and have the stub JavaScript file ready. Next, enter the following code:
var i=0;
for (i=0;i<=10;i++)
    {if (i==3)
        {
            continue;
        }
    document.write("The number is " + i);
    document.write("<br/>");
}
Setting breakpoints
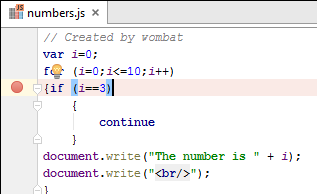
Now let’s set breakpoints to our JavaScript file. This is most easy – just click the left gutter at the line you want the script to suspend:
Configuring a server
Creating a server
To create a server, follow these steps:
Open the Settings/Preferences dialog (press Ctrl+Alt+S or click
 on the main toolbar)
Expand the node Build, Execution, Deployment, and click the page Deployment.
On the Deployment page, click
 .
.Specify the server name
MyRemoteServerand typelocal or mounted server.
Configuring connection and mappings
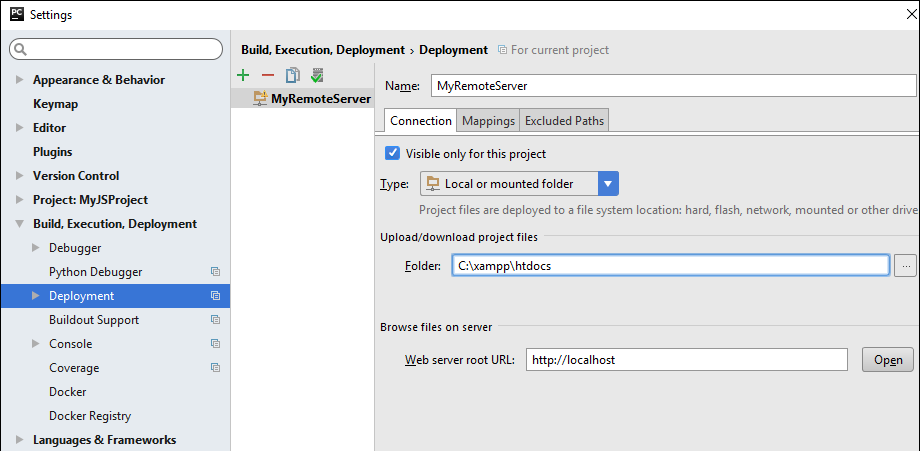
Then, configure the server. In the Connection tab, specify the directory where your local files will be uploaded; in our case, this directory is C:\xampp\htdocs - it means that the local files will be uploaded to this directory:
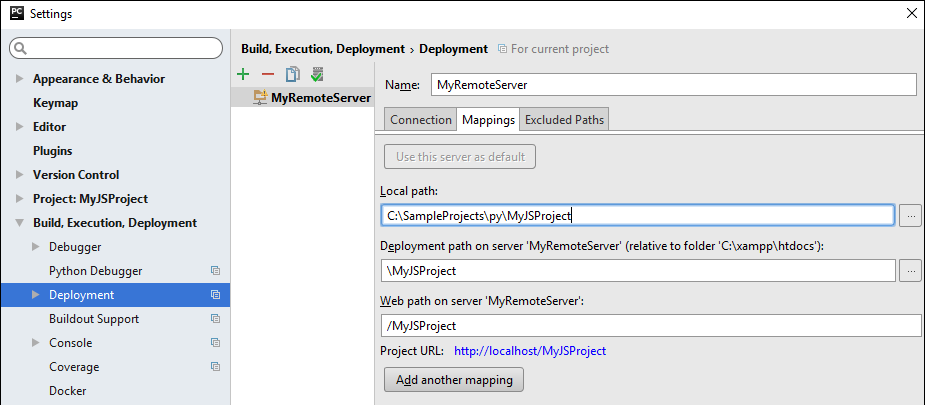
Next, click the Mappings tab. Here define the local path, the deployment path on the server (which is relative to the folder specified in the Connection tab), and the Web path on the server:
Defining project default server
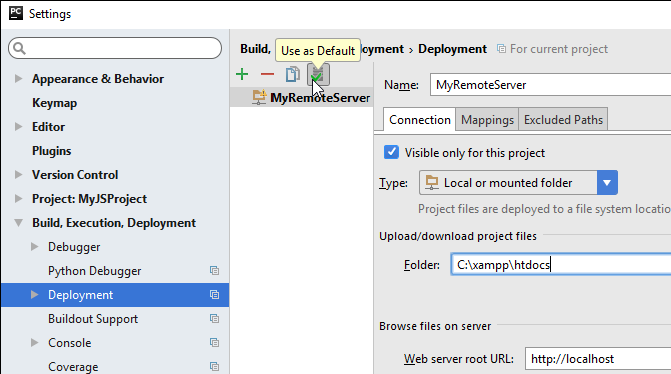
Make the server the project default. To do that, click ![]() button in the Deployment toolbar.
button in the Deployment toolbar.
Click OK to apply changes are close the Settings/Preferences dialog.
Finally, copy your project (C:\SampleProjects\py\MyJSProject) to C:\xampp\htdocs.
Viewing the server
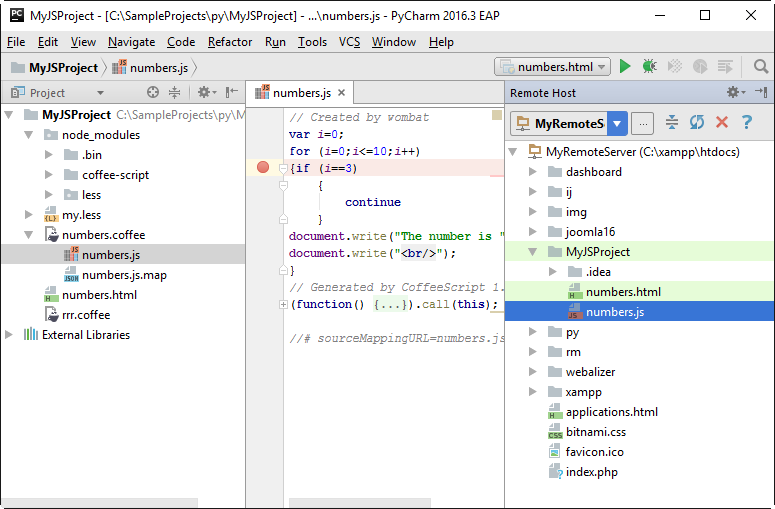
Let's make sure the server is up and running, and, which is even more important, visible to PyCharm. To do that, on the main menu, choose . The Remote Hosts tool window shows the newly created server:
Deploying file to the server
With PyCharm, it's just a snap... For example, you can easily do that via the main menu: choose , or use the context menu:
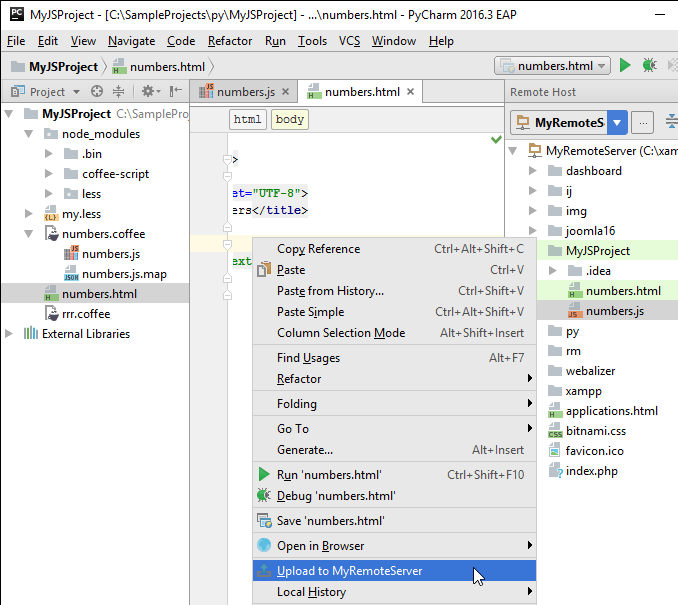
The upload result is shown below:

Debugging
Starting the debugger session
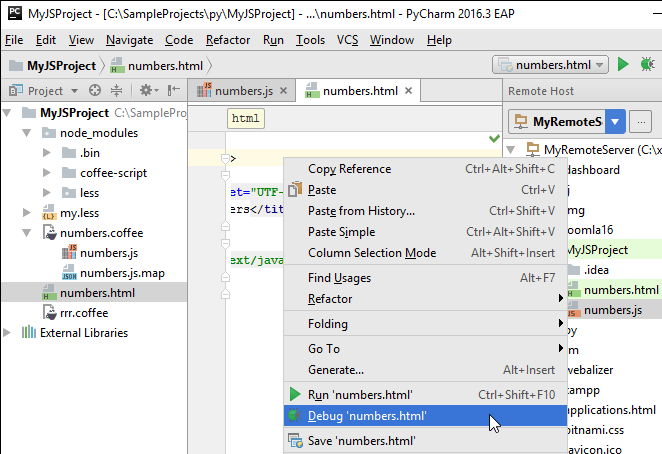
All the preliminary steps are done, and it’s time to proceed to the debugging session. To start it, right-click the background of the file numbers.html, and choose Debug 'number.html' on the context menu - thus you will launch the debugger with the default temporary run/debug configuration:
Examining the debugger information
When the debugging session is launched, your HTML page appears in the browser, and the Debug tool window opens. Your program execution suspends when the first breakpoint is hit. Such a breakpoint is marked with a blue stripe:
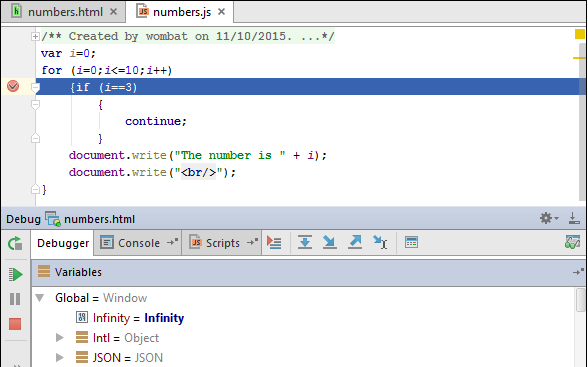
As you step through your application, the corresponding information appears in the Debug tool window, and in the page of your web browser:
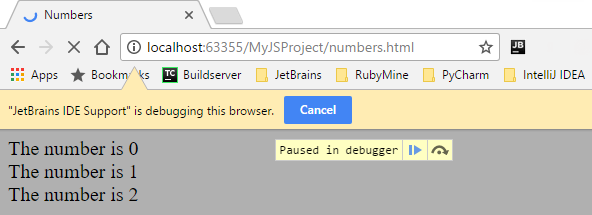
To step though the script, click ![]() or
or ![]() ; to terminate the debugger session, close the yellow banner, or click Cancel.
; to terminate the debugger session, close the yellow banner, or click Cancel.
Summary
This tutorial is over. You've refreshed your knowledge about the following issues:
Created a server, configured its connection and mapping.
Deployed a file to the server.
Added breakpoints to your JavaScript code.
Started the debug session and examined the debugger information.