Scientific mode
Scientific mode in PyCharm provides support for interactive scientific computing and data visualization. The following packages must be properly installed:
To learn how to install packages to your PyCharm interpreter, read the section Install, uninstall, and upgrade packages.
When a numpy import is detected, PyCharm shows the banner that suggests you to enable the Scientific mode:

Scientific mode
With this mode enabled, the following changes are introduced to the UI:
The Scientific Mode check command in the menu is automatically selected.
Python console is shown.
The Documentation tool window appears (a pinned version of the Quick Documentation popup), showing the inline documentation for the symbol at caret:

DataFrame/Array view appears in the Python console and in the Debug tool window.
In the Scientific mode, a graph opens in its own tab in the SciView window, allowing you to resize it, zoom in and out, and so on. You can alter this behavior by toggling the Show plots in tool window checkbox ().
Scientific project
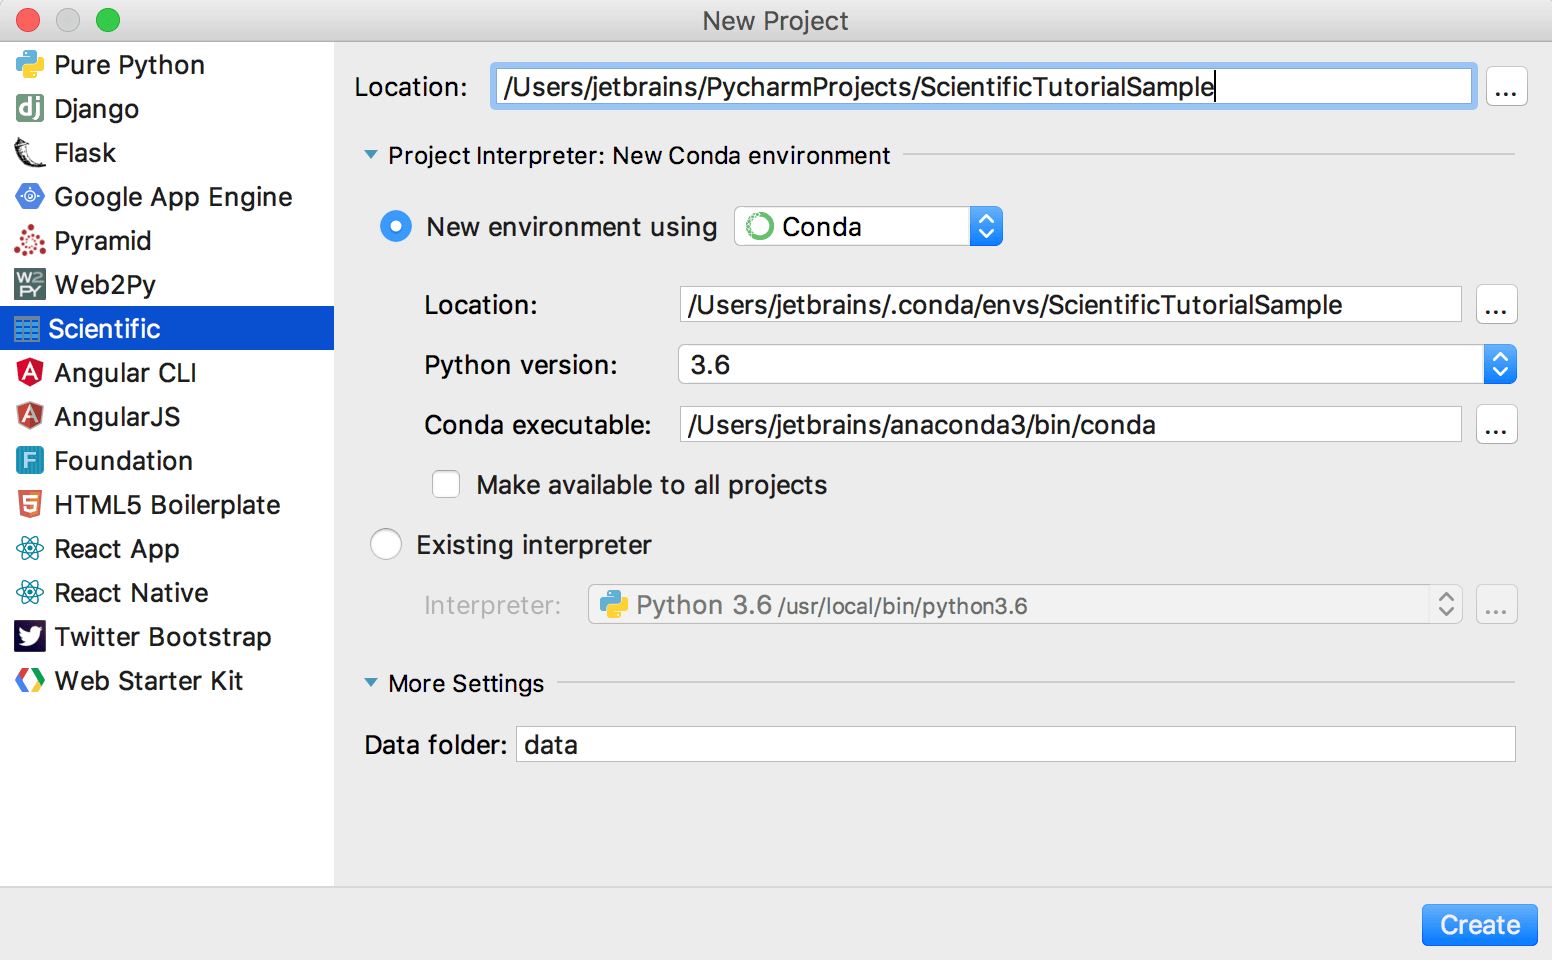
You can get all the Scientific mode settings predefined by choosing the corresponding project type in the New Project wizard.

When choosing the Scientific project type, you need to ensure that you have Conda interpreter installed. Once this is done, all you need is to specify the project name. You can also alter the name of the data folder if needed.
Matplotlib in the console
Matplotlib is available also in console. See the Running in console section of the Scientific Mode tutorial.
With Matplotlib imported, the following happens:
-
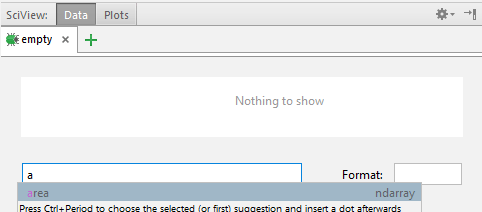
When you open SciView tool window with the debug session stopped, an empty tab is shown, where you can type the variables from the console:

In the Format field, one can specify the format of representing the output.
Note that when you launch your files in the SciView mode, the command line is automatically shown after the script execution.
-
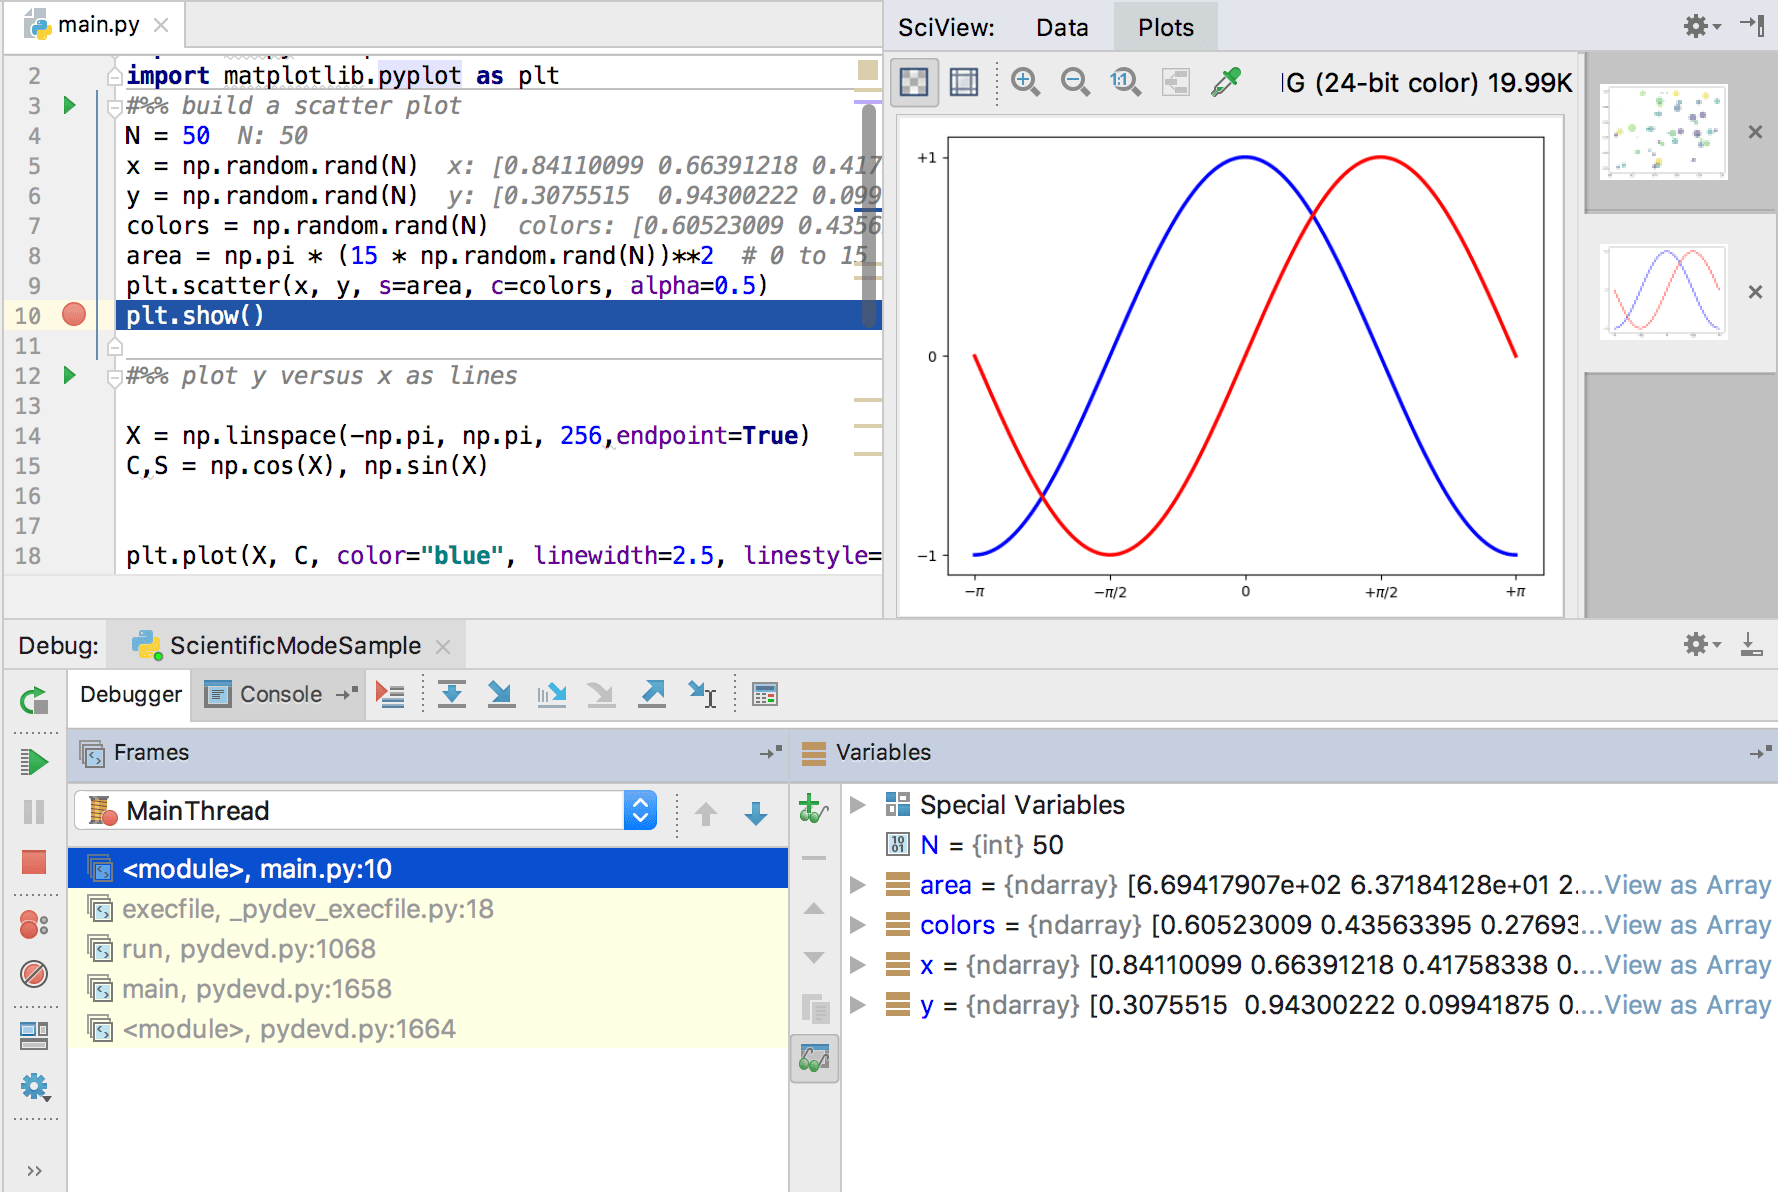
When stopping on a breakpoint, a tab appears in the SciView with the graph being debugged:

See the Debug section of the Scientific Mode tutorial.
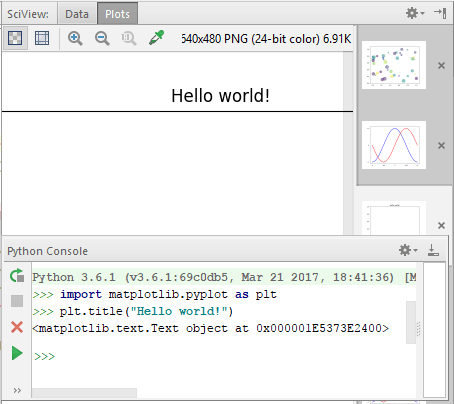
When starting a Python console (), one can import Matplotlib, and build graphs as required:

The Python console is accessible for further inputs.